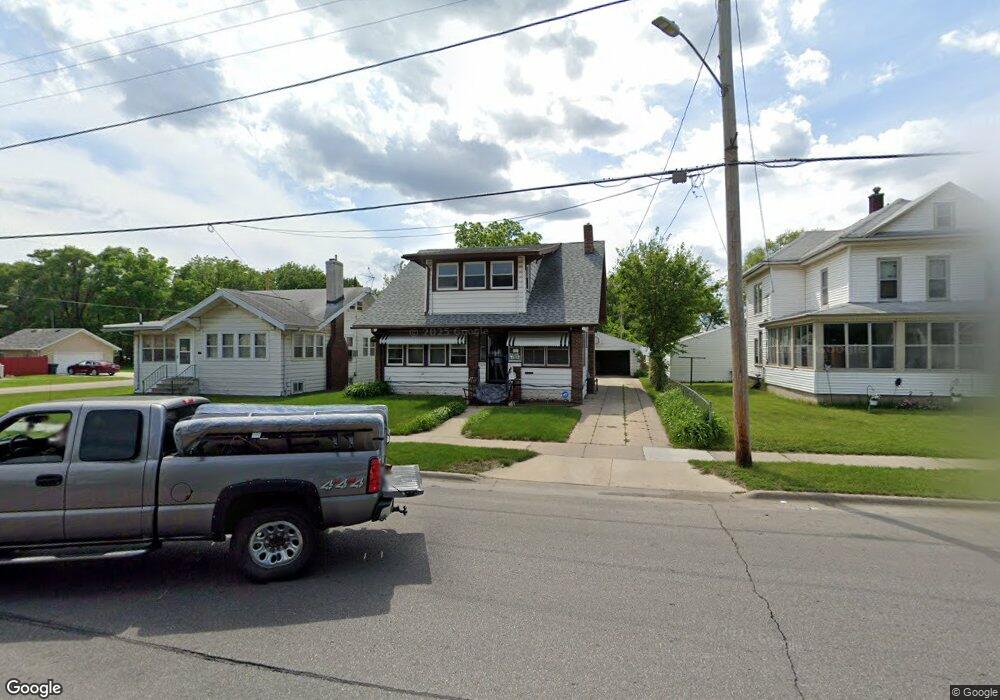
1929 E 4th St Waterloo, IA 50703
Gates Park NeighborhoodEstimated Value: $92,000 - $126,000
4
Beds
2
Baths
1,631
Sq Ft
$66/Sq Ft
Est. Value
About This Home
This home is located at 1929 E 4th St, Waterloo, IA 50703 and is currently estimated at $108,418, approximately $66 per square foot. 1929 E 4th St is a home located in Black Hawk County with nearby schools including Cunningham School, George Washington Carver Academy, and East High School.
Ownership History
Date
Name
Owned For
Owner Type
Purchase Details
Closed on
Jun 16, 2017
Sold by
Tyler Sherel D and Stanford Sherel D
Bought by
Stanford Sherel D
Current Estimated Value
Home Financials for this Owner
Home Financials are based on the most recent Mortgage that was taken out on this home.
Original Mortgage
$67,116
Outstanding Balance
$57,485
Interest Rate
5.25%
Mortgage Type
FHA
Estimated Equity
$50,933
Purchase Details
Closed on
Jul 24, 2007
Sold by
Frizell Mary Lou and Frizell Mary L
Bought by
Tyler Sherel D
Home Financials for this Owner
Home Financials are based on the most recent Mortgage that was taken out on this home.
Original Mortgage
$77,040
Interest Rate
6.76%
Mortgage Type
FHA
Purchase Details
Closed on
Jun 6, 2007
Sold by
Frizell Richard L
Bought by
Frizell Mary Lou
Home Financials for this Owner
Home Financials are based on the most recent Mortgage that was taken out on this home.
Original Mortgage
$77,040
Interest Rate
6.76%
Mortgage Type
FHA
Create a Home Valuation Report for This Property
The Home Valuation Report is an in-depth analysis detailing your home's value as well as a comparison with similar homes in the area
Home Values in the Area
Average Home Value in this Area
Purchase History
| Date | Buyer | Sale Price | Title Company |
|---|---|---|---|
| Stanford Sherel D | -- | None Available | |
| Tyler Sherel D | $80,000 | Black Hawk County Abstract C | |
| Frizell Mary Lou | -- | None Available |
Source: Public Records
Mortgage History
| Date | Status | Borrower | Loan Amount |
|---|---|---|---|
| Open | Stanford Sherel D | $67,116 | |
| Closed | Tyler Sherel D | $77,040 |
Source: Public Records
Tax History
| Year | Tax Paid | Tax Assessment Tax Assessment Total Assessment is a certain percentage of the fair market value that is determined by local assessors to be the total taxable value of land and additions on the property. | Land | Improvement |
|---|---|---|---|---|
| 2025 | $1,378 | $86,830 | $6,500 | $80,330 |
| 2024 | $1,378 | $73,760 | $6,500 | $67,260 |
| 2023 | $1,060 | $73,760 | $6,500 | $67,260 |
| 2022 | $1,030 | $57,170 | $6,500 | $50,670 |
| 2021 | $1,487 | $57,170 | $6,500 | $50,670 |
| 2020 | $1,140 | $54,540 | $3,900 | $50,640 |
| 2019 | $2,040 | $54,540 | $3,900 | $50,640 |
| 2018 | $1,147 | $54,540 | $3,900 | $50,640 |
| 2017 | $1,235 | $54,540 | $3,900 | $50,640 |
| 2016 | $1,040 | $54,540 | $3,900 | $50,640 |
| 2015 | $1,040 | $54,540 | $3,900 | $50,640 |
| 2014 | $1,060 | $54,540 | $3,900 | $50,640 |
Source: Public Records
Map
Nearby Homes
Your Personal Tour Guide
Ask me questions while you tour the home.