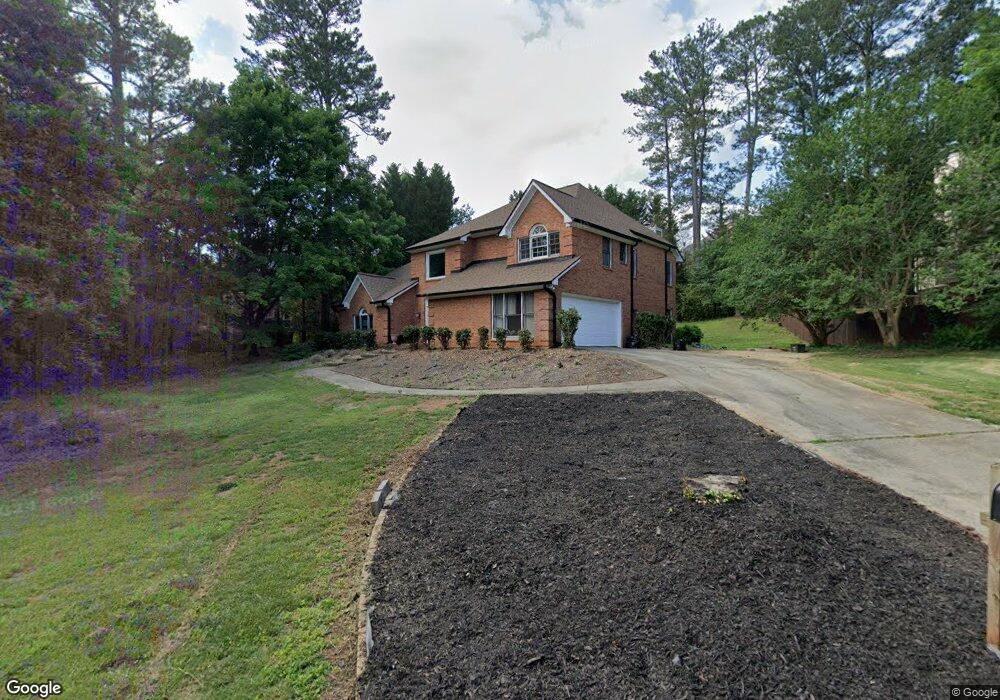
1929 Hunters Bend Ct Marietta, GA 30062
East Cobb NeighborhoodEstimated Value: $595,000 - $735,000
3
Beds
3
Baths
3,208
Sq Ft
$210/Sq Ft
Est. Value
About This Home
This home is located at 1929 Hunters Bend Ct, Marietta, GA 30062 and is currently estimated at $672,245, approximately $209 per square foot. 1929 Hunters Bend Ct is a home located in Cobb County with nearby schools including Murdock Elementary School, Dodgen Middle School, and Pope High School.
Ownership History
Date
Name
Owned For
Owner Type
Purchase Details
Closed on
Feb 28, 2005
Sold by
Rutenberg Hill Ltd
Bought by
Cobb Co
Current Estimated Value
Purchase Details
Closed on
Jul 11, 2003
Sold by
Jalalat Sanaz
Bought by
Conliff Dana
Home Financials for this Owner
Home Financials are based on the most recent Mortgage that was taken out on this home.
Original Mortgage
$180,000
Interest Rate
5.2%
Mortgage Type
New Conventional
Purchase Details
Closed on
Dec 6, 2002
Sold by
Option One Mtg Loan Tr 2001 (Ct)
Bought by
Jalalat Sanaz
Purchase Details
Closed on
Jun 4, 2002
Sold by
Wooten Donald
Bought by
Bank Wells Fargo
Purchase Details
Closed on
May 25, 2000
Sold by
Johnson Lonald R and Johnson Patricia P
Bought by
Wooten Donald
Home Financials for this Owner
Home Financials are based on the most recent Mortgage that was taken out on this home.
Original Mortgage
$231,900
Interest Rate
8.14%
Mortgage Type
New Conventional
Create a Home Valuation Report for This Property
The Home Valuation Report is an in-depth analysis detailing your home's value as well as a comparison with similar homes in the area
Home Values in the Area
Average Home Value in this Area
Purchase History
| Date | Buyer | Sale Price | Title Company |
|---|---|---|---|
| Cobb Co | -- | -- | |
| Conliff Dana | $240,000 | -- | |
| Jalalat Sanaz | $180,000 | -- | |
| Bank Wells Fargo | $266,628 | -- | |
| Wooten Donald | $231,900 | -- |
Source: Public Records
Mortgage History
| Date | Status | Borrower | Loan Amount |
|---|---|---|---|
| Previous Owner | Conliff Dana | $180,000 | |
| Previous Owner | Wooten Donald | $231,900 |
Source: Public Records
Tax History Compared to Growth
Tax History
| Year | Tax Paid | Tax Assessment Tax Assessment Total Assessment is a certain percentage of the fair market value that is determined by local assessors to be the total taxable value of land and additions on the property. | Land | Improvement |
|---|---|---|---|---|
| 2025 | $4,813 | $198,488 | $41,400 | $157,088 |
| 2024 | $4,817 | $198,488 | $41,400 | $157,088 |
| 2023 | $4,274 | $198,488 | $41,400 | $157,088 |
| 2022 | $4,576 | $185,760 | $36,000 | $149,760 |
| 2021 | $3,722 | $146,760 | $29,880 | $116,880 |
| 2020 | $3,450 | $134,300 | $23,400 | $110,900 |
| 2019 | $3,450 | $134,300 | $23,400 | $110,900 |
| 2018 | $3,450 | $134,300 | $23,400 | $110,900 |
| 2017 | $3,495 | $142,148 | $23,400 | $118,748 |
| 2016 | $2,721 | $106,840 | $23,400 | $83,440 |
| 2015 | $2,855 | $109,944 | $25,200 | $84,744 |
| 2014 | $2,877 | $109,944 | $0 | $0 |
Source: Public Records
Map
Nearby Homes
- 1942 Hunters Bend Ct
- 3825 Emerson St
- 1680 Bill Murdock Rd
- 3495 Mill Bridge Dr Unit 2
- 3650 Oak Ln
- 3218 Holly Mill Run
- 3402 Devoe Ct
- 3246 Able Ct
- 3999 Tall Pine Dr
- 4039 Tall Pine Dr
- 2041 Kramer Way
- 2225 Johnson Ferry Rd
- 3761 Oak Ln
- 4031 Oak Forest Cir
- 2237 Chadds Creek Dr
- 3741 Bays Ferry Way
- 3292 Holly Mill Ct
- 1931 Hunters Bend Ct
- 1902 Rand Ridge Ct
- 1906 Rand Ridge Ct
- 1910 Rand Ridge Ct
- 1933 Hunters Bend Ct
- 1875 Bill Murdock Rd
- 1863 Bill Murdock Rd
- 0 Rand Ridge Ct Unit 8333110
- 0 Rand Ridge Ct Unit 8063674
- 0 Rand Ridge Ct Unit 3257324
- 0 Rand Ridge Ct
- 1887 Bill Murdock Rd
- 1865 Leighton Ln NE
- 1914 Rand Ridge Ct
- 1935 Hunters Bend Ct Unit 4
- 1935 Hunters Bend Ct
- 1851 Bill Murdock Rd Unit 1
- 1905 Rand Ridge Ct
- 1937 Hunters Bend Ct
- 1899 Bill Murdock Rd