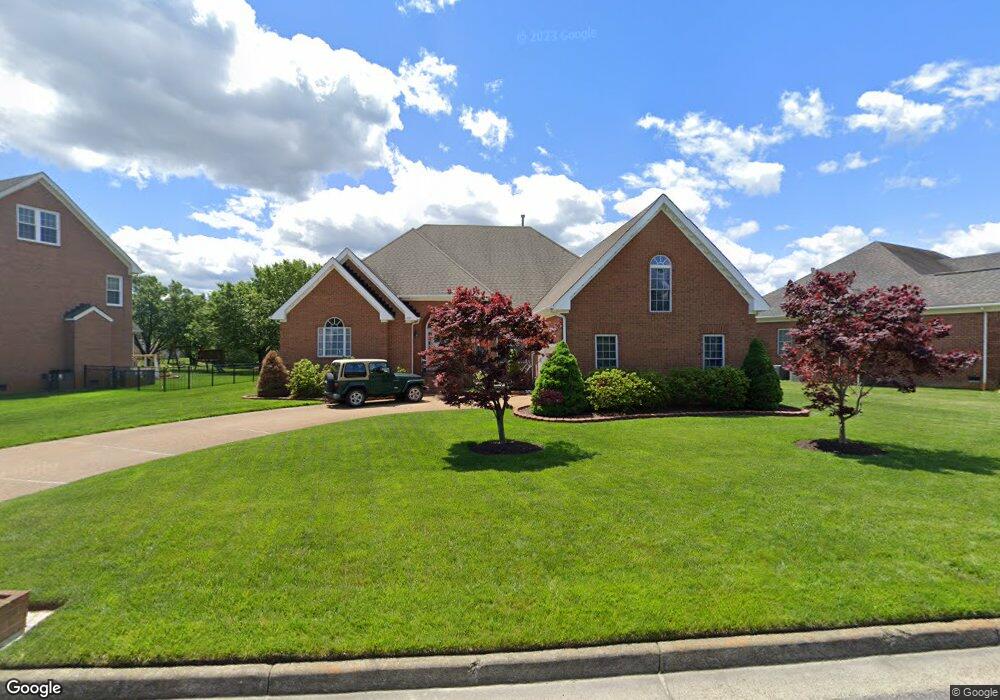
1929 Lancing Crest Ln Chesapeake, VA 23323
Deep Creek NeighborhoodEstimated Value: $631,000 - $688,000
4
Beds
3
Baths
2,917
Sq Ft
$225/Sq Ft
Est. Value
About This Home
This home is located at 1929 Lancing Crest Ln, Chesapeake, VA 23323 and is currently estimated at $656,460, approximately $225 per square foot. 1929 Lancing Crest Ln is a home located in Chesapeake City with nearby schools including Grassfield Elementary School, Hugo A. Owens Middle, and Grassfield High School.
Ownership History
Date
Name
Owned For
Owner Type
Purchase Details
Closed on
Aug 25, 2020
Sold by
Kelly James R and Kelly Jacqulyn K
Bought by
Ferguson Leslie and Gerguson Jennifer
Current Estimated Value
Home Financials for this Owner
Home Financials are based on the most recent Mortgage that was taken out on this home.
Original Mortgage
$311,430
Outstanding Balance
$276,374
Interest Rate
2.9%
Mortgage Type
New Conventional
Estimated Equity
$380,086
Purchase Details
Closed on
Apr 17, 2001
Sold by
L R Hill Custom Bldrs Inc
Bought by
Kelly James R
Home Financials for this Owner
Home Financials are based on the most recent Mortgage that was taken out on this home.
Original Mortgage
$243,900
Interest Rate
6.85%
Purchase Details
Closed on
Nov 18, 1999
Sold by
New Mill Development Asso
Bought by
L R Hill Custom Bldrs Inc
Home Financials for this Owner
Home Financials are based on the most recent Mortgage that was taken out on this home.
Original Mortgage
$240,000
Interest Rate
7.76%
Create a Home Valuation Report for This Property
The Home Valuation Report is an in-depth analysis detailing your home's value as well as a comparison with similar homes in the area
Home Values in the Area
Average Home Value in this Area
Purchase History
| Date | Buyer | Sale Price | Title Company |
|---|---|---|---|
| Ferguson Leslie | $444,900 | Attorney | |
| Kelly James R | $305,000 | -- | |
| L R Hill Custom Bldrs Inc | $74,500 | -- |
Source: Public Records
Mortgage History
| Date | Status | Borrower | Loan Amount |
|---|---|---|---|
| Open | Ferguson Leslie | $311,430 | |
| Previous Owner | Kelly James R | $243,900 | |
| Previous Owner | L R Hill Custom Bldrs Inc | $240,000 |
Source: Public Records
Tax History Compared to Growth
Tax History
| Year | Tax Paid | Tax Assessment Tax Assessment Total Assessment is a certain percentage of the fair market value that is determined by local assessors to be the total taxable value of land and additions on the property. | Land | Improvement |
|---|---|---|---|---|
| 2025 | $6,193 | $642,200 | $200,000 | $442,200 |
| 2024 | $6,193 | $613,200 | $185,000 | $428,200 |
| 2023 | $5,175 | $560,300 | $165,000 | $395,300 |
| 2022 | $5,246 | $519,400 | $145,000 | $374,400 |
| 2021 | $4,550 | $433,300 | $125,000 | $308,300 |
| 2020 | $4,176 | $397,700 | $125,000 | $272,700 |
| 2019 | $4,484 | $427,000 | $125,000 | $302,000 |
| 2018 | $4,533 | $431,700 | $130,000 | $301,700 |
| 2017 | $4,533 | $431,700 | $130,000 | $301,700 |
| 2016 | $4,533 | $431,700 | $130,000 | $301,700 |
| 2015 | $3,360 | $426,700 | $125,000 | $301,700 |
| 2014 | $4,068 | $387,400 | $125,000 | $262,400 |
Source: Public Records
Map
Nearby Homes
- 1920 Lancing Crest Ln
- 1928 Moses Grandy Trail
- 2001 Kelsey Bay Ct
- 2000 Kelsey Bay Ct
- 2219 Angler Ln
- 1918 Mccoy Rd
- 1917 Mccoy Rd
- 1916 Mccoy Rd
- 1908 Mccoy Rd
- 1906 Mccoy Rd
- 2031 Kinston Waters Ct
- 1725 Burson Dr
- 2014 Millville Rd
- 1704 Kaywood Ln
- 2139 Sunset Maple Ln
- 1957 Rockwood Dr
- 1860 Millville Rd
- 1605 Redwing Arcade
- 1312 False Creek Way
- 1634 Whistling Rd
- 1933 Lancing Crest Ln
- 1925 Lancing Crest Ln
- 1921 Lancing Crest Ln
- 1937 Lancing Crest Ln
- 1928 Lancing Crest Ln
- 1932 Lancing Crest Ln
- 1934 Lancing Crest Ln
- 1926 Lancing Crest Ln
- 1930 Lancing Crest Ln
- 1941 Lancing Crest Ln
- 1919 Lancing Crest Ln
- 1936 Lancing Crest Ln
- 1924 Lancing Crest Ln
- 1945 Lancing Crest Ln
- 1922 Lancing Crest Ln
- 1915 Lancing Crest Ln
- 401 Bracey Way
- 1940 Lancing Crest Ln
- 1913 Lancing Crest Ln
- 1949 Lancing Crest Ln