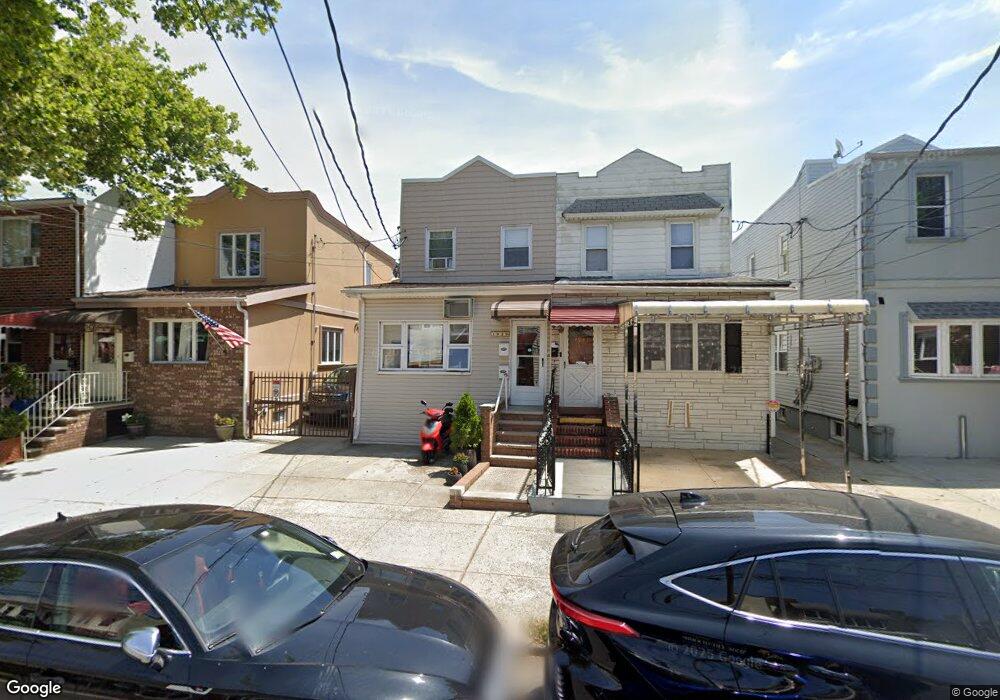
1929 W 8th St Brooklyn, NY 11223
Gravesend NeighborhoodEstimated Value: $839,440 - $1,016,000
--
Bed
--
Bath
928
Sq Ft
$1,017/Sq Ft
Est. Value
About This Home
This home is located at 1929 W 8th St, Brooklyn, NY 11223 and is currently estimated at $943,860, approximately $1,017 per square foot. 1929 W 8th St is a home located in Kings County with nearby schools including P.S. 97 - The Highlawn, Is 228 David A Boody, and Hebrew Language Academy Charter 2.
Ownership History
Date
Name
Owned For
Owner Type
Purchase Details
Closed on
Jul 12, 2004
Sold by
Sacco Anne and Sacco Patrick M
Bought by
Giapoutzis Kostas
Current Estimated Value
Home Financials for this Owner
Home Financials are based on the most recent Mortgage that was taken out on this home.
Original Mortgage
$295,000
Interest Rate
6.28%
Mortgage Type
Purchase Money Mortgage
Create a Home Valuation Report for This Property
The Home Valuation Report is an in-depth analysis detailing your home's value as well as a comparison with similar homes in the area
Home Values in the Area
Average Home Value in this Area
Purchase History
| Date | Buyer | Sale Price | Title Company |
|---|---|---|---|
| Giapoutzis Kostas | $395,000 | -- | |
| Giapoutzis Kostas | $395,000 | -- |
Source: Public Records
Mortgage History
| Date | Status | Borrower | Loan Amount |
|---|---|---|---|
| Open | Giapoutzis Kostas | $60,000 | |
| Closed | Giapoutzis Kostas | $60,000 | |
| Previous Owner | Giapoutzis Kostas | $295,000 |
Source: Public Records
Tax History Compared to Growth
Tax History
| Year | Tax Paid | Tax Assessment Tax Assessment Total Assessment is a certain percentage of the fair market value that is determined by local assessors to be the total taxable value of land and additions on the property. | Land | Improvement |
|---|---|---|---|---|
| 2025 | $5,389 | $57,720 | $10,440 | $47,280 |
| 2024 | $5,389 | $46,440 | $10,440 | $36,000 |
| 2023 | $5,141 | $51,240 | $10,440 | $40,800 |
| 2022 | $5,054 | $48,180 | $10,440 | $37,740 |
| 2021 | $5,066 | $44,280 | $10,440 | $33,840 |
| 2020 | $2,480 | $43,140 | $10,440 | $32,700 |
| 2019 | $4,678 | $43,140 | $10,440 | $32,700 |
| 2018 | $4,300 | $21,096 | $4,359 | $16,737 |
| 2017 | $4,300 | $21,096 | $5,251 | $15,845 |
| 2016 | $4,011 | $20,062 | $6,525 | $13,537 |
| 2015 | $2,405 | $19,752 | $7,282 | $12,470 |
| 2014 | $2,405 | $18,634 | $8,244 | $10,390 |
Source: Public Records
Map
Nearby Homes