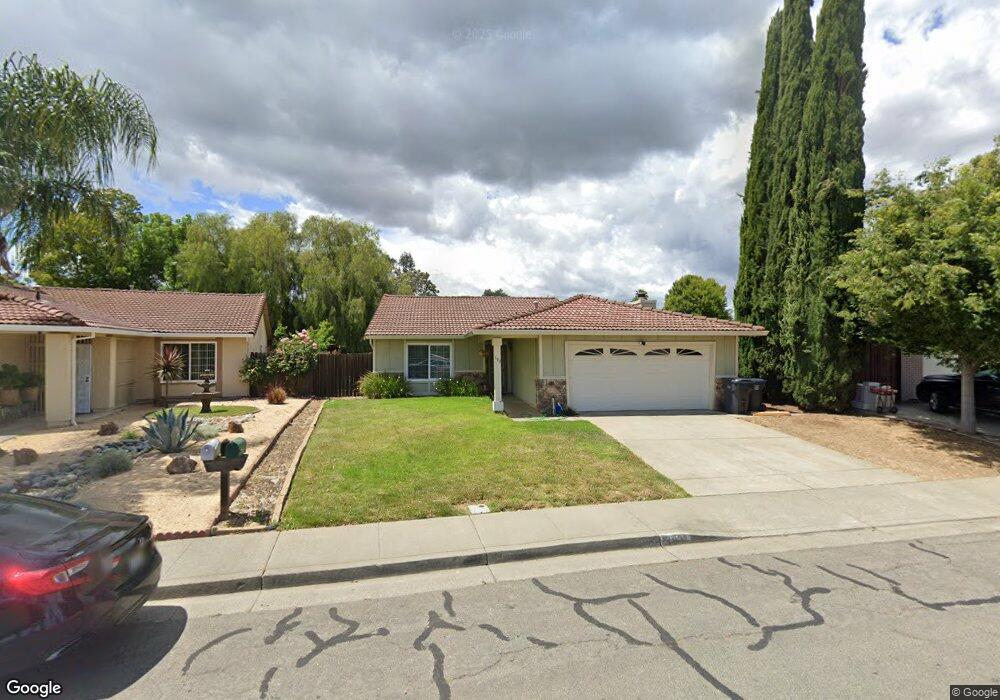
193 Burgundy Way Fairfield, CA 94533
Estimated Value: $463,000 - $503,000
3
Beds
2
Baths
1,178
Sq Ft
$405/Sq Ft
Est. Value
About This Home
This home is located at 193 Burgundy Way, Fairfield, CA 94533 and is currently estimated at $477,603, approximately $405 per square foot. 193 Burgundy Way is a home located in Solano County with nearby schools including Crystal Middle School, Armijo High School, and We R Family Christian School.
Ownership History
Date
Name
Owned For
Owner Type
Purchase Details
Closed on
Aug 27, 2023
Sold by
David Rizalino L and David Maria C
Bought by
Rizalino And Maria David Family Trust and David
Current Estimated Value
Purchase Details
Closed on
Jan 23, 2002
Sold by
Gambill Brock I and Gambill Abigail
Bought by
David Rizalino L and David Maria C
Home Financials for this Owner
Home Financials are based on the most recent Mortgage that was taken out on this home.
Original Mortgage
$173,600
Interest Rate
7.11%
Purchase Details
Closed on
Jun 27, 2000
Sold by
Benton Thompson
Bought by
Gambill Brock I and Gambill Abigail
Home Financials for this Owner
Home Financials are based on the most recent Mortgage that was taken out on this home.
Original Mortgage
$171,666
Interest Rate
8.67%
Mortgage Type
VA
Purchase Details
Closed on
Jun 2, 1994
Sold by
Thompson Janice D and Thompson Benton
Bought by
Thompson Benton and Thompson Janice
Create a Home Valuation Report for This Property
The Home Valuation Report is an in-depth analysis detailing your home's value as well as a comparison with similar homes in the area
Home Values in the Area
Average Home Value in this Area
Purchase History
| Date | Buyer | Sale Price | Title Company |
|---|---|---|---|
| Rizalino And Maria David Family Trust | -- | None Listed On Document | |
| David Rizalino L | $217,000 | Fidelity National Title Co | |
| Gambill Brock I | $169,000 | First American Title Guarant | |
| Thompson Benton | -- | -- |
Source: Public Records
Mortgage History
| Date | Status | Borrower | Loan Amount |
|---|---|---|---|
| Previous Owner | David Rizalino L | $173,600 | |
| Previous Owner | Gambill Brock I | $171,666 |
Source: Public Records
Tax History Compared to Growth
Tax History
| Year | Tax Paid | Tax Assessment Tax Assessment Total Assessment is a certain percentage of the fair market value that is determined by local assessors to be the total taxable value of land and additions on the property. | Land | Improvement |
|---|---|---|---|---|
| 2025 | $3,591 | $320,562 | $96,017 | $224,545 |
| 2024 | $3,591 | $314,278 | $94,135 | $220,143 |
| 2023 | $3,481 | $308,117 | $92,291 | $215,826 |
| 2022 | $3,439 | $302,077 | $90,482 | $211,595 |
| 2021 | $3,405 | $296,155 | $88,708 | $207,447 |
| 2020 | $3,326 | $293,119 | $87,799 | $205,320 |
| 2019 | $3,244 | $287,373 | $86,078 | $201,295 |
| 2018 | $3,349 | $281,740 | $84,391 | $197,349 |
| 2017 | $3,194 | $276,217 | $82,737 | $193,480 |
| 2016 | $3,168 | $270,802 | $81,115 | $189,687 |
| 2015 | $2,828 | $255,000 | $64,000 | $191,000 |
| 2014 | $2,513 | $224,000 | $58,000 | $166,000 |
Source: Public Records
Map
Nearby Homes
- 1944 Diamond Way
- 435 Hamilton Dr
- 109 Creek View Cir
- 113 Creek View Cir
- 266 De Soto Dr
- 2537 Woolner Ave
- 1625 Park Ln Unit 11
- 1842 Minnesota St
- 1007 4th St
- 225 Pennsylvania Ave Unit B5
- 1661 Minnesota St
- 1137 Ohio St
- 1731 Michigan St
- 527 Great Jones St
- 1042 Hayes St
- 1201 Missouri St
- 1200 Truman St
- 1047 Ohio St
- 0 Illinois St Unit 325091474
- 519 Taylor St
- 187 Burgundy Way
- 199 Burgundy Way
- 2065 Diamond Way
- 181 Burgundy Way
- 2073 Diamond Way
- 2202 Cabernet Ct
- 192 Burgundy Way
- 2208 Cabernet Ct
- 198 Burgundy Way
- 186 Burgundy Way
- 175 Burgundy Way
- 2081 Diamond Way
- 2064 Diamond Way
- 2203 Cabernet Ct
- 2048 Diamond Way
- 2040 Diamond Way
- 2072 Diamond Way
- 169 Burgundy Way
- 2032 Diamond Way