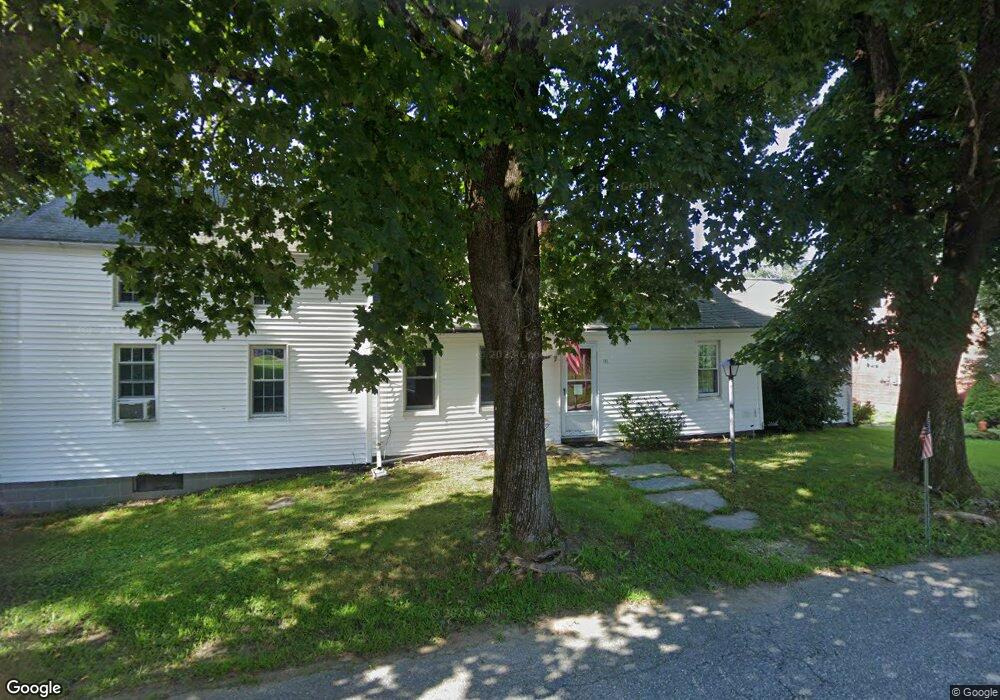
193 Chase Rd Thompson, CT 06277
Estimated Value: $519,915 - $570,000
4
Beds
2
Baths
2,108
Sq Ft
$257/Sq Ft
Est. Value
About This Home
This home is located at 193 Chase Rd, Thompson, CT 06277 and is currently estimated at $541,979, approximately $257 per square foot. 193 Chase Rd is a home located in Windham County with nearby schools including Mary R. Fisher Elementary School, Thompson Middle School, and Tourtellotte Memorial High School.
Ownership History
Date
Name
Owned For
Owner Type
Purchase Details
Closed on
Sep 2, 2015
Sold by
Morin Marc P
Bought by
Morin Marc P and Morin Jesse P
Current Estimated Value
Purchase Details
Closed on
Mar 8, 2012
Sold by
Morin Laurie A
Bought by
Morin Marc P
Purchase Details
Closed on
Aug 2, 2001
Sold by
Reynolds Robert W and Reynolds Mildred C
Bought by
Avanecean Karl
Create a Home Valuation Report for This Property
The Home Valuation Report is an in-depth analysis detailing your home's value as well as a comparison with similar homes in the area
Home Values in the Area
Average Home Value in this Area
Purchase History
| Date | Buyer | Sale Price | Title Company |
|---|---|---|---|
| Morin Marc P | -- | -- | |
| Morin Marc P | -- | -- | |
| Morin Marc P | -- | -- | |
| Morin Marc P | -- | -- | |
| Avanecean Karl | $220,000 | -- | |
| Avanecean Karl | $220,000 | -- |
Source: Public Records
Mortgage History
| Date | Status | Borrower | Loan Amount |
|---|---|---|---|
| Open | Avanecean Karl | $248,270 | |
| Previous Owner | Avanecean Karl | $80,000 |
Source: Public Records
Tax History
| Year | Tax Paid | Tax Assessment Tax Assessment Total Assessment is a certain percentage of the fair market value that is determined by local assessors to be the total taxable value of land and additions on the property. | Land | Improvement |
|---|---|---|---|---|
| 2025 | $5,990 | $315,270 | $65,470 | $249,800 |
| 2024 | $6,000 | $213,430 | $45,930 | $167,500 |
| 2023 | $5,549 | $213,430 | $45,930 | $167,500 |
| 2022 | $5,340 | $213,430 | $45,930 | $167,500 |
| 2021 | $5,325 | $213,430 | $45,930 | $167,500 |
| 2020 | $5,171 | $213,430 | $45,930 | $167,500 |
| 2019 | $4,901 | $176,630 | $48,230 | $128,400 |
| 2018 | $4,901 | $176,630 | $48,230 | $128,400 |
| 2017 | $4,603 | $176,630 | $48,230 | $128,400 |
| 2016 | $4,603 | $176,630 | $48,230 | $128,400 |
| 2015 | $4,373 | $176,330 | $47,930 | $128,400 |
| 2014 | $4,277 | $187,000 | $50,700 | $136,300 |
Source: Public Records
Map
Nearby Homes
- 369 Thompson Rd
- 3 Westside Dr Unit 14
- 151 Brandy Hill Rd
- 11 Wrightson Dr
- 436 Providence Pike
- 99 Azud Rd
- 45 Breaults Landing Rd
- 125 Hagstrom Rd
- 75 Elmwood Hill Rd
- 74 Riverside Dr
- 100 Hawkins Rd
- 661 Riverside Dr
- 80 Aldrich Rd
- 115 Groveland Ave
- 115 Groveland Ave Unit 7 & 8
- 47 Groveland Ave
- 43 Groveland Ave
- 0 W Thompson Rd Unit 24146108
- 55 Mechanics St
- 66 Oak Hill Dr
Your Personal Tour Guide
Ask me questions while you tour the home.