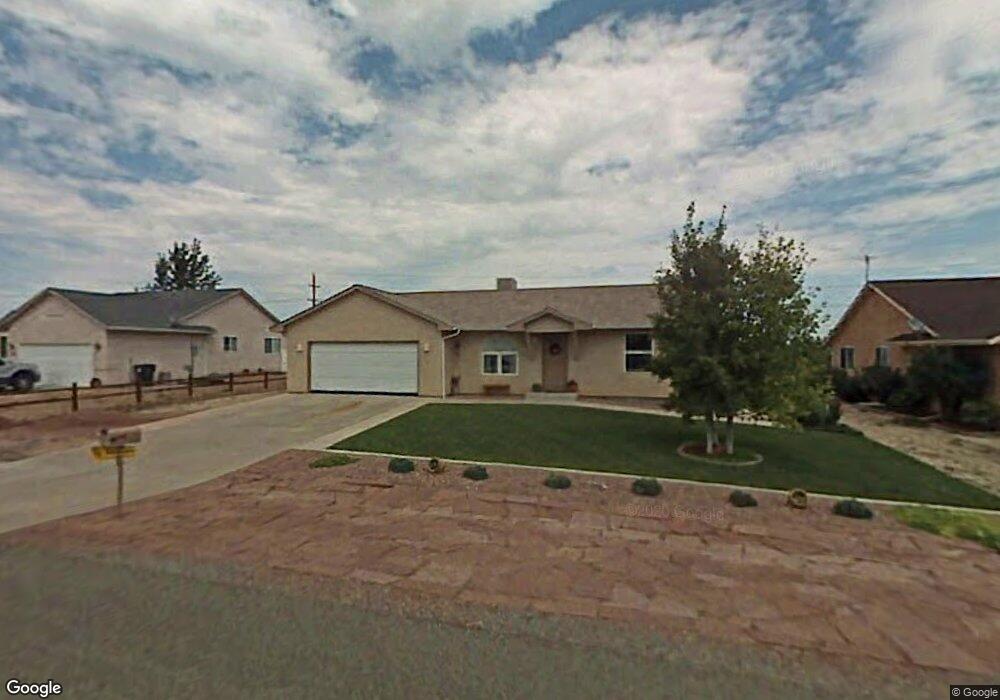
193 E Arvada Dr Pueblo, CO 81007
Estimated Value: $313,604 - $342,000
3
Beds
3
Baths
1,104
Sq Ft
$297/Sq Ft
Est. Value
About This Home
This home is located at 193 E Arvada Dr, Pueblo, CO 81007 and is currently estimated at $327,651, approximately $296 per square foot. 193 E Arvada Dr is a home located in Pueblo County with nearby schools including Liberty Point Elementary School, Liberty Point International School, and Pueblo West High School.
Ownership History
Date
Name
Owned For
Owner Type
Purchase Details
Closed on
Sep 10, 1997
Bought by
Cook Michal E + Sheryl L
Current Estimated Value
Purchase Details
Closed on
Apr 30, 1997
Sold by
Land Marketing Company
Purchase Details
Closed on
Feb 14, 1997
Sold by
Spohnholz Norma M
Bought by
Omega Place Inc
Purchase Details
Closed on
Apr 8, 1994
Sold by
Wolfe Caroline Margaret
Bought by
Spohnholz Norma M
Purchase Details
Closed on
Jan 10, 1992
Sold by
Pohnholz Conrad S
Bought by
Wolfe Caroline Margaret
Purchase Details
Closed on
Jan 10, 1991
Sold by
Omega Place Inc
Bought by
Land Marketing Company
Purchase Details
Closed on
Mar 2, 1990
Sold by
Mcdonough Constance N
Bought by
Pohnholz Conrad S
Purchase Details
Closed on
May 8, 1989
Sold by
Spohnholz Charles J + Norma
Bought by
Mcdonough Constance N
Purchase Details
Closed on
May 24, 1977
Sold by
Lawyers Title Of Pueblo Truste
Bought by
Spohnholz Charles J + Norma
Create a Home Valuation Report for This Property
The Home Valuation Report is an in-depth analysis detailing your home's value as well as a comparison with similar homes in the area
Home Values in the Area
Average Home Value in this Area
Purchase History
| Date | Buyer | Sale Price | Title Company |
|---|---|---|---|
| Cook Michal E + Sheryl L | $85,500 | -- | |
| -- | -- | -- | |
| Land Marketing Company | $5,000 | -- | |
| Omega Place Inc | $2,400 | -- | |
| Spohnholz Norma M | -- | -- | |
| Wolfe Caroline Margaret | -- | -- | |
| Land Marketing Company | -- | -- | |
| Pohnholz Conrad S | -- | -- | |
| Mcdonough Constance N | -- | -- | |
| Spohnholz Charles J + Norma | -- | -- |
Source: Public Records
Tax History
| Year | Tax Paid | Tax Assessment Tax Assessment Total Assessment is a certain percentage of the fair market value that is determined by local assessors to be the total taxable value of land and additions on the property. | Land | Improvement |
|---|---|---|---|---|
| 2024 | $1,207 | $18,610 | -- | -- |
| 2023 | $1,220 | $22,300 | $3,350 | $18,950 |
| 2022 | $762 | $14,453 | $2,080 | $12,373 |
| 2021 | $782 | $14,880 | $2,150 | $12,730 |
| 2020 | $619 | $14,880 | $2,150 | $12,730 |
| 2019 | $1,218 | $12,190 | $486 | $11,704 |
| 2018 | $1,050 | $10,500 | $490 | $10,010 |
| 2017 | $1,051 | $10,500 | $490 | $10,010 |
| 2016 | $992 | $9,925 | $716 | $9,209 |
| 2015 | $984 | $9,925 | $716 | $9,209 |
| 2014 | $893 | $9,000 | $796 | $8,204 |
Source: Public Records
Map
Nearby Homes
- 200 E Ohio Dr
- 228 E Arvada Dr
- 238 E Ohio Dr
- 202 E Beshoar Dr
- 465 S Falcon Dr
- 441 S Oak Creek Dr
- 601 S Inca Dr
- 576 S Falcon Dr
- 104 W Idaho Springs Dr
- 602 S Del Rio Dr
- 74 E Idaho Springs Dr
- 422 S Gilia Dr
- 349 S Joe Martinez Blvd
- 442 S Del Norte Ave
- 424 S Del Norte Ave
- 438 S Del Norte Ave
- 649 S Bayfield Ave
- 357 S Joe Martinez Blvd
- 662 S Bayfield Ave
- 727 S Joe Martinez Ln
- 203 E Arvada Dr
- 185 E Arvada Dr
- 211 E Arvada Dr
- 194 E Arvada Dr
- 186 E Arvada Dr
- 186 E Arvada Dr Unit 12
- 219 E Arvada Dr
- 208 E Ohio Dr
- 212 E Arvada Dr
- 214 E Ohio Dr
- 174 E Arvada Dr
- 155 E Arvada Dr
- 218 E Ohio Dr
- 220 E Arvada Dr
- 162 E Arvada Dr
- 227 E Arvada Dr
- 224 E Ohio Dr
- 200 E Ohio Dr Unit 8
- 191 E Beshoar Dr
- 197 E Beshoar Dr
Your Personal Tour Guide
Ask me questions while you tour the home.