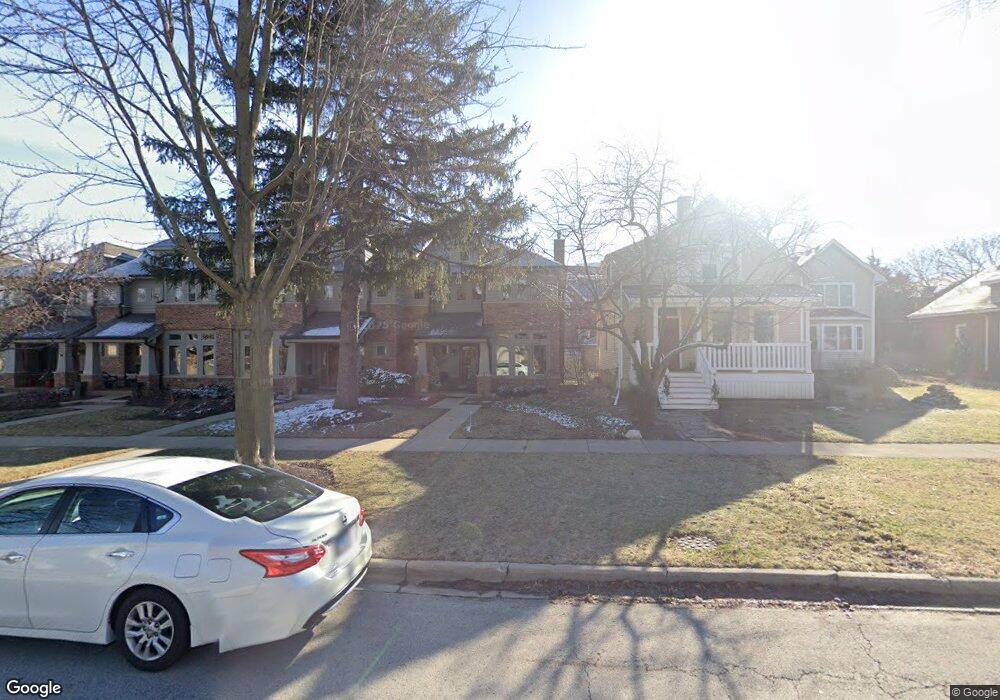
193 N Larch Ave Unit 1A Elmhurst, IL 60126
Estimated Value: $960,000 - $1,064,000
--
Bed
--
Bath
2,394
Sq Ft
$422/Sq Ft
Est. Value
About This Home
This home is located at 193 N Larch Ave Unit 1A, Elmhurst, IL 60126 and is currently estimated at $1,009,520, approximately $421 per square foot. 193 N Larch Ave Unit 1A is a home located in DuPage County with nearby schools including Reinberg Elementary School, Ruggles Elementary School, and Hawthorne Elementary School.
Ownership History
Date
Name
Owned For
Owner Type
Purchase Details
Closed on
Feb 27, 2015
Sold by
Exiner Mark and Exiner Karen
Bought by
The Mark E Exiner & Karen K Exiner 2014
Current Estimated Value
Purchase Details
Closed on
Jul 18, 2003
Sold by
Meadow Woods Association
Bought by
Exiner Mark and Exiner Karen
Home Financials for this Owner
Home Financials are based on the most recent Mortgage that was taken out on this home.
Original Mortgage
$315,000
Interest Rate
4.12%
Mortgage Type
Purchase Money Mortgage
Purchase Details
Closed on
Apr 18, 2002
Sold by
Lanz Roland E and Lanz Maria
Bought by
Meadow Woods Associates-Larch Avenue Pra
Purchase Details
Closed on
Oct 11, 1994
Sold by
Lanz Rolando E and Lanz Maria A
Bought by
Lanz Rolando E and Lanz Maria A
Create a Home Valuation Report for This Property
The Home Valuation Report is an in-depth analysis detailing your home's value as well as a comparison with similar homes in the area
Home Values in the Area
Average Home Value in this Area
Purchase History
| Date | Buyer | Sale Price | Title Company |
|---|---|---|---|
| The Mark E Exiner & Karen K Exiner 2014 | -- | None Available | |
| Exiner Mark | $644,500 | Ctic | |
| Meadow Woods Associates-Larch Avenue Pra | $320,000 | -- | |
| Lanz Rolando E | -- | -- |
Source: Public Records
Mortgage History
| Date | Status | Borrower | Loan Amount |
|---|---|---|---|
| Previous Owner | Exiner Mark | $315,000 |
Source: Public Records
Tax History Compared to Growth
Tax History
| Year | Tax Paid | Tax Assessment Tax Assessment Total Assessment is a certain percentage of the fair market value that is determined by local assessors to be the total taxable value of land and additions on the property. | Land | Improvement |
|---|---|---|---|---|
| 2024 | $15,122 | $266,922 | $26,689 | $240,233 |
| 2023 | $14,013 | $246,830 | $24,680 | $222,150 |
| 2022 | $14,050 | $242,700 | $24,270 | $218,430 |
| 2021 | $13,698 | $236,670 | $23,670 | $213,000 |
| 2020 | $13,989 | $245,280 | $24,530 | $220,750 |
| 2019 | $13,687 | $233,200 | $23,320 | $209,880 |
| 2018 | $13,061 | $221,830 | $22,200 | $199,630 |
| 2017 | $12,126 | $201,310 | $20,140 | $181,170 |
| 2016 | $11,858 | $189,640 | $18,970 | $170,670 |
| 2015 | $11,725 | $176,670 | $17,670 | $159,000 |
| 2014 | $10,857 | $151,880 | $15,190 | $136,690 |
| 2013 | $11,119 | $154,020 | $15,400 | $138,620 |
Source: Public Records
Map
Nearby Homes
- 210 N Addison Ave Unit 202
- 195 N Addison Ave Unit PH03
- 193 N Elm Ave
- 254 N Addison Ave
- 258 N Addison Ave
- 260 N Addison Ave
- 262 N Addison Ave
- 131 W Adelaide St Unit 309
- 104 Evergreen Ave
- 145 S York St Unit 404
- 145 S York St Unit 322
- 314 N Elm Ave
- 286 N Indiana St
- 196 N Walnut St
- 240 N Willow Rd
- 120 N Walnut St
- 355 W 1st St
- 183 E Grantley Ave
- 110 N Pine St
- 153 S Kenmore Ave
- 195 N Larch Ave
- 197 N Larch Ave Unit 1C
- 199 N Larch Ave Unit D
- 201 N Larch Ave
- 196 N Addison Ave
- 198 N Addison Ave
- 185 N Larch Ave
- 192 N Addison Ave
- 192 N Addison Ave Unit TWHS
- 192 N Addison Ave Unit 1
- 202 N Addison Ave
- 204 N Addison Ave
- 190 N Addison Ave
- 206 N Addison Ave
- 188 N Addison Ave
- 205 N Larch Ave Unit 2C
- 208 N Addison Ave
- 186 N Addison Ave
- 177 N Larch Ave Unit 1A
- 212 N Addison Ave