193 Nautilus Dr Unit 1 Vallejo, CA 94591
Glen Cove NeighborhoodEstimated Value: $587,000 - $648,000
About This Home
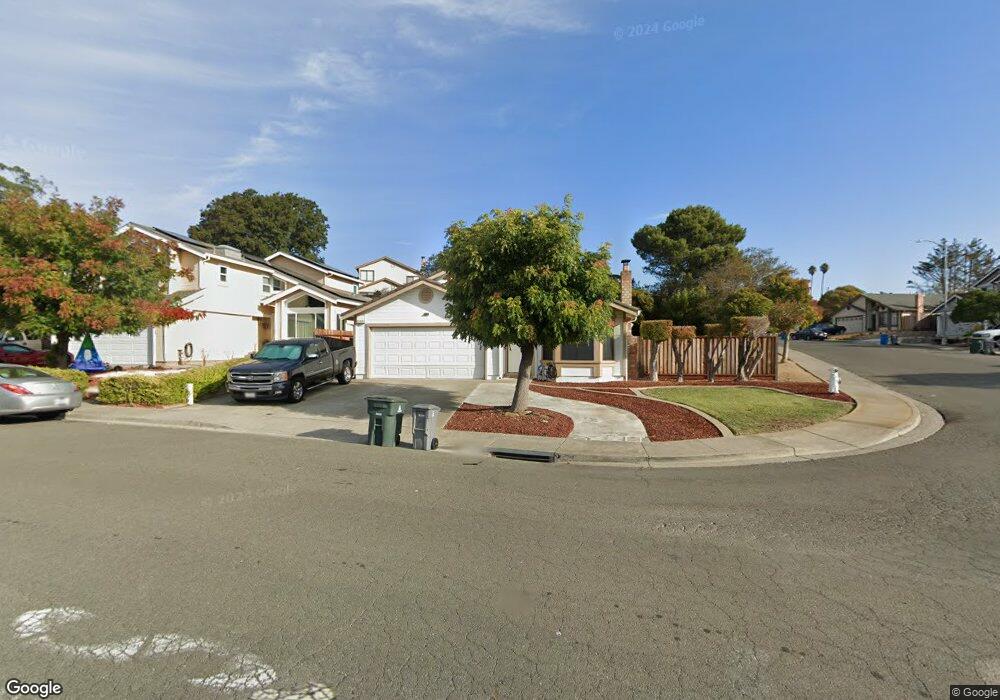
This home is located at 193 Nautilus Dr Unit 1, Vallejo, CA 94591 and is currently estimated at $609,246, approximately $350 per square foot. 193 Nautilus Dr Unit 1 is a home located in Solano County with nearby schools including Glen Cove Elementary, Jesse M. Bethel High School, and Vallejo Charter School.
Ownership History
We collect this data history from publicly available records. To have your information removed, we recommend requesting removal directly through your county’s website.
Purchase Details
Home Financials for this Owner
Home Financials are based on the most recent Mortgage that was taken out on this home.Purchase Details
Purchase Details
Home Financials for this Owner
Home Financials are based on the most recent Mortgage that was taken out on this home.Home Values in the Area
Average Home Value in this Area
Purchase History
We collect this data history from publicly available records. To have your information removed, we recommend requesting removal directly through your county’s website.
| Date | Buyer | Sale Price | Title Company |
|---|---|---|---|
| $40,000 | None Available | ||
| $54,000 | None Available | ||
| -- | Commerce Title Company |
Mortgage History
We collect this data history from publicly available records. To have your information removed, we recommend requesting removal directly through your county’s website.
| Date | Status | Borrower | Loan Amount |
|---|---|---|---|
| Open | $100,000 | ||
| Previous Owner | $59,000 |
Tax History
We collect this data history from publicly available records. To have your information removed, we recommend requesting removal directly through your county’s website.
| Year | Tax Paid | Tax Assessment Tax Assessment Total Assessment is a certain percentage of the fair market value that is determined by local assessors to be the total taxable value of land and additions on the property. | Land | Improvement |
|---|---|---|---|---|
| 2025 | $4,088 | $239,568 | $64,052 | $175,516 |
| 2024 | $4,088 | $234,872 | $62,797 | $172,075 |
| 2023 | $3,850 | $230,267 | $61,566 | $168,701 |
| 2022 | $3,746 | $225,753 | $60,359 | $165,394 |
| 2021 | $3,664 | $221,327 | $59,176 | $162,151 |
| 2020 | $3,669 | $219,059 | $58,570 | $160,489 |
| 2019 | $3,557 | $214,765 | $57,422 | $157,343 |
| 2018 | $3,338 | $210,555 | $56,297 | $154,258 |
| 2017 | $3,192 | $206,428 | $55,194 | $151,234 |
| 2016 | $2,606 | $202,381 | $54,112 | $148,269 |
| 2015 | $2,572 | $199,342 | $53,300 | $146,042 |
| 2014 | $2,442 | $195,438 | $52,256 | $143,182 |
Map
- 621 New Bedford Dr
- 101 Thresher Dr
- 1020 Pueblo Ct
- 1181 Bush Ave
- 449 Gilcrest Ave
- 436 Gillcrest Ave
- 154 Outrigger Dr
- 420 Gillcrest Ave
- 1259 Fulton Ave
- 279 Clearpointe Dr
- 474 La Jolla St
- 469 La Jolla St
- 227 Clearpointe Dr
- 126 Barington Dr
- 1940 Magazine St
- 319 Ladera Dr
- 2 Jordan St
- 1146 Lewis Ave
- 128 Chesapeake Dr
- 117 Jordan St
- 189 Nautilus Dr
- 185 Nautilus Dr
- 791 Pueblo Way
- 775 Pueblo Way
- 210 Thresher Dr
- 220 Thresher Dr
- 200 Thresher Dr
- 767 Pueblo Way
- 230 Thresher Dr
- 181 Nautilus Dr
- 190 Thresher Dr
- 191 Thresher Dr
- 240 Thresher Dr
- 759 Pueblo Way
- 250 Thresher Dr
- 180 Thresher Dr
- 177 Nautilus Dr
- 751 Pueblo Way
- 181 Thresher Dr
- 753 Starfish Dr
Ask me questions while you tour the home.