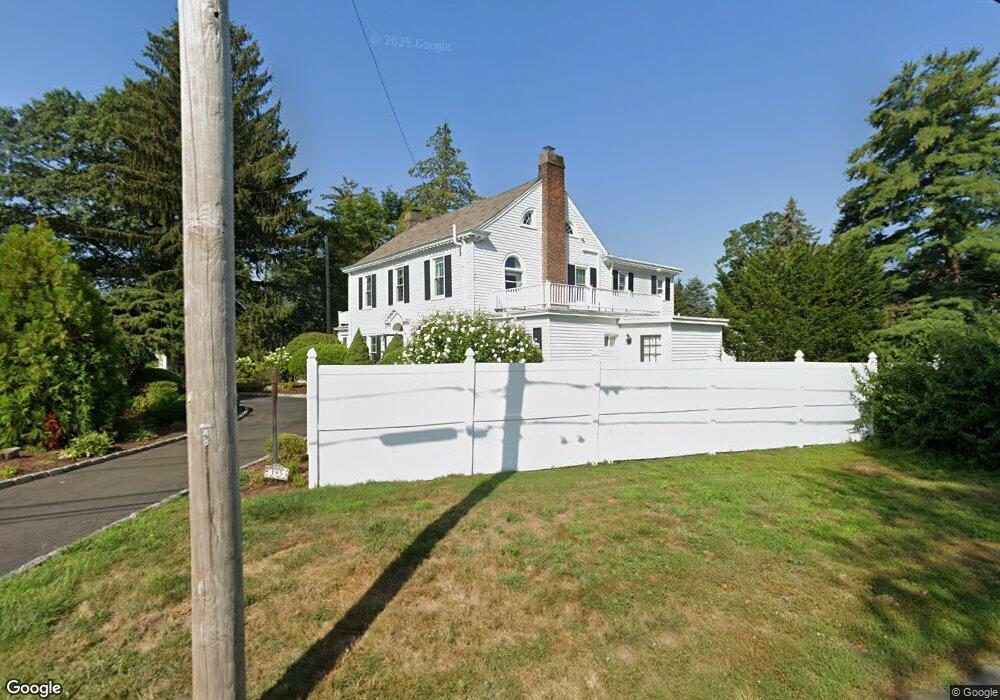
193 Sturges Rd Fairfield, CT 06824
Estimated Value: $1,290,000 - $1,654,000
4
Beds
4
Baths
2,878
Sq Ft
$500/Sq Ft
Est. Value
About This Home
This home is located at 193 Sturges Rd, Fairfield, CT 06824 and is currently estimated at $1,440,406, approximately $500 per square foot. 193 Sturges Rd is a home located in Fairfield County with nearby schools including Riverfield Elementary School, Roger Ludlowe Middle School, and Fairfield Ludlowe High School.
Ownership History
Date
Name
Owned For
Owner Type
Purchase Details
Closed on
Oct 30, 2020
Sold by
Novak Karen R
Bought by
Galbo Anthony and Galbo Molly A
Current Estimated Value
Home Financials for this Owner
Home Financials are based on the most recent Mortgage that was taken out on this home.
Original Mortgage
$600,000
Interest Rate
2.7%
Mortgage Type
New Conventional
Purchase Details
Closed on
Sep 17, 1993
Sold by
Seaburg Bruce and Seaburg Janet S
Bought by
Novak John J and Novak Karen R
Home Financials for this Owner
Home Financials are based on the most recent Mortgage that was taken out on this home.
Original Mortgage
$170,000
Interest Rate
7.16%
Mortgage Type
Unknown
Create a Home Valuation Report for This Property
The Home Valuation Report is an in-depth analysis detailing your home's value as well as a comparison with similar homes in the area
Home Values in the Area
Average Home Value in this Area
Purchase History
| Date | Buyer | Sale Price | Title Company |
|---|---|---|---|
| Galbo Anthony | $800,000 | None Available | |
| Galbo Anthony | $800,000 | None Available | |
| Novak John J | $440,000 | -- | |
| Novak John J | $440,000 | -- |
Source: Public Records
Mortgage History
| Date | Status | Borrower | Loan Amount |
|---|---|---|---|
| Previous Owner | Galbo Anthony | $600,000 | |
| Previous Owner | Novak John J | $200,000 | |
| Previous Owner | Novak John J | $170,000 | |
| Previous Owner | Novak John J | $337,500 |
Source: Public Records
Tax History Compared to Growth
Tax History
| Year | Tax Paid | Tax Assessment Tax Assessment Total Assessment is a certain percentage of the fair market value that is determined by local assessors to be the total taxable value of land and additions on the property. | Land | Improvement |
|---|---|---|---|---|
| 2025 | $17,029 | $599,830 | $370,090 | $229,740 |
| 2024 | $16,735 | $599,830 | $370,090 | $229,740 |
| 2023 | $16,501 | $599,830 | $370,090 | $229,740 |
| 2022 | $16,339 | $599,830 | $370,090 | $229,740 |
| 2021 | $16,183 | $599,830 | $370,090 | $229,740 |
| 2020 | $16,324 | $609,350 | $341,810 | $267,540 |
| 2019 | $16,324 | $609,350 | $341,810 | $267,540 |
| 2018 | $16,062 | $609,350 | $341,810 | $267,540 |
| 2017 | $15,733 | $609,350 | $341,810 | $267,540 |
| 2016 | $15,508 | $609,350 | $341,810 | $267,540 |
| 2015 | $18,097 | $730,030 | $480,620 | $249,410 |
| 2014 | $17,813 | $730,030 | $480,620 | $249,410 |
Source: Public Records
Map
Nearby Homes
- 647 Bronson Rd
- 400 Bronson Rd
- 21 Beaumont St
- 43 Helen St
- 53 Hilltop Dr
- 245 Unquowa Rd Unit 34
- 245 Unquowa Rd Unit 11
- 245 Unquowa Rd Unit 33
- 88 Overhill Rd
- 100 Overhill Rd
- 209 S Pine Creek Rd
- 57 Beaumont Place
- 476 Mill Hill Terrace
- 226 Ruane St
- 28 Mill Hill Rd Unit 28
- 85 Patrick Dr
- 232 Pell Meadow Dr
- 844 Mill Hill Terrace
- 83 Pell Meadow Dr
- 127 Paul Place
- 225 Sturges Rd
- 1492 Unquowa Rd
- 1502 Unquowa Rd
- 208 Sturges Rd
- 1478 Unquowa Rd
- 216 Sturges Rd
- 251 Sturges Rd
- 180 Sturges Rd
- 1548 Unquowa Rd
- 1435 Unquowa Rd
- 375 N Pine Creek Rd
- 1540 Unquowa Rd
- 1564 Unquowa Rd
- 236 Sturges Rd
- 30 Merton St
- 265 Sturges Rd
- 1446 Unquowa Rd
- 132 Sturges Rd
- 42 Merton St
- 72 Merton St