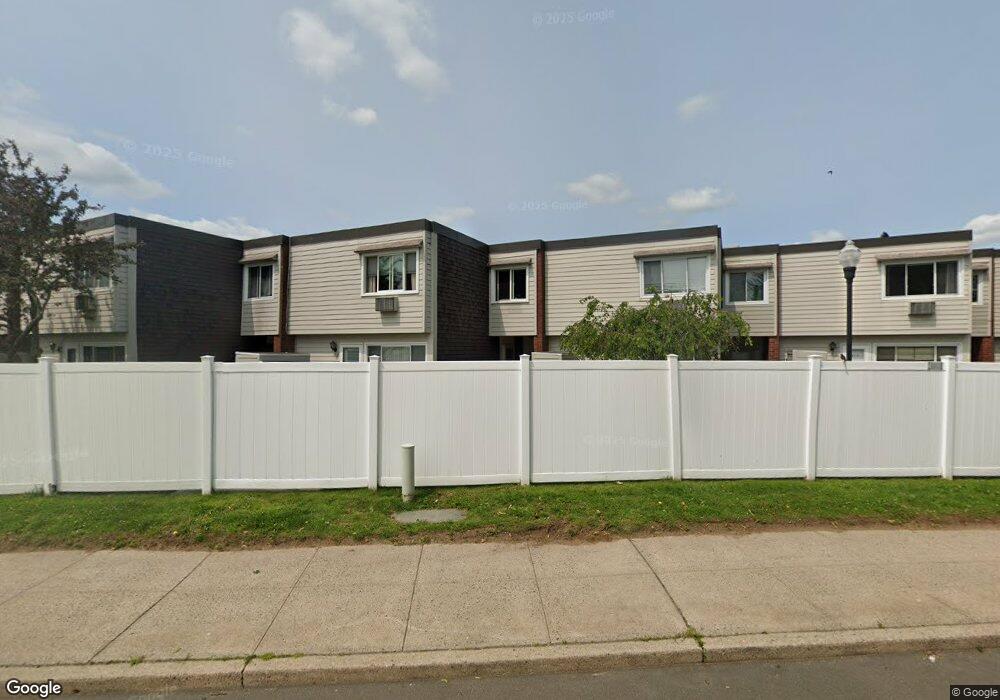
193 West Walk West Haven, CT 06516
West Haven Center NeighborhoodEstimated Value: $297,000 - $314,552
2
Beds
2
Baths
1,174
Sq Ft
$261/Sq Ft
Est. Value
About This Home
This home is located at 193 West Walk, West Haven, CT 06516 and is currently estimated at $306,138, approximately $260 per square foot. 193 West Walk is a home located in New Haven County with nearby schools including Carrigan 5/6 Intermediate School, Harry M. Bailey Middle School, and West Haven High School.
Ownership History
Date
Name
Owned For
Owner Type
Purchase Details
Closed on
Jul 26, 2017
Sold by
Sandacata Kenneth J and Sandacata Dennis P
Bought by
Arango Obed and Kautz Kathy L
Current Estimated Value
Home Financials for this Owner
Home Financials are based on the most recent Mortgage that was taken out on this home.
Original Mortgage
$126,000
Outstanding Balance
$104,995
Interest Rate
3.91%
Mortgage Type
Purchase Money Mortgage
Estimated Equity
$201,143
Purchase Details
Closed on
May 19, 2000
Sold by
Marsella Cindi
Bought by
Pasquale Sandacata Ret
Purchase Details
Closed on
May 20, 1999
Sold by
Fleet Funding Inc
Bought by
Marsella Cindi
Home Financials for this Owner
Home Financials are based on the most recent Mortgage that was taken out on this home.
Original Mortgage
$60,800
Interest Rate
6.88%
Create a Home Valuation Report for This Property
The Home Valuation Report is an in-depth analysis detailing your home's value as well as a comparison with similar homes in the area
Home Values in the Area
Average Home Value in this Area
Purchase History
| Date | Buyer | Sale Price | Title Company |
|---|---|---|---|
| Arango Obed | $140,000 | -- | |
| Pasquale Sandacata Ret | $111,000 | -- | |
| Marsella Cindi | $76,000 | -- |
Source: Public Records
Mortgage History
| Date | Status | Borrower | Loan Amount |
|---|---|---|---|
| Open | Marsella Cindi | $126,000 | |
| Previous Owner | Marsella Cindi | $132,000 | |
| Previous Owner | Marsella Cindi | $60,800 |
Source: Public Records
Tax History Compared to Growth
Tax History
| Year | Tax Paid | Tax Assessment Tax Assessment Total Assessment is a certain percentage of the fair market value that is determined by local assessors to be the total taxable value of land and additions on the property. | Land | Improvement |
|---|---|---|---|---|
| 2025 | $6,654 | $192,710 | $0 | $192,710 |
| 2024 | $4,504 | $92,820 | $0 | $92,820 |
| 2023 | $4,317 | $92,820 | $0 | $92,820 |
| 2022 | $4,233 | $92,820 | $0 | $92,820 |
| 2021 | $4,233 | $92,820 | $0 | $92,820 |
| 2020 | $5,080 | $100,660 | $0 | $100,660 |
| 2019 | $4,899 | $100,660 | $0 | $100,660 |
| 2018 | $4,857 | $100,660 | $0 | $100,660 |
| 2017 | $4,596 | $100,660 | $0 | $100,660 |
| 2016 | $4,586 | $100,660 | $0 | $100,660 |
| 2015 | $5,406 | $133,980 | $0 | $133,980 |
| 2014 | $5,373 | $133,980 | $0 | $133,980 |
Source: Public Records
Map
Nearby Homes
- 184 West Walk
- 193 West Walk Unit 193
- 192 West Walk
- 183 West Walk
- 194 West Walk
- 185 West Walk
- 191 West Walk
- 195 West Walk
- 186 West Walk
- 186 West Walk Unit 186
- 195 West Walk Unit 195
- 198 West Walk
- 187 West Walk
- 198 West Walk Unit 198
- 190 West Walk
- 190 West Walk Unit 190
- 197 West Walk
- 188 West Walk
- 197 West Walk Unit 197
- 174 West Walk