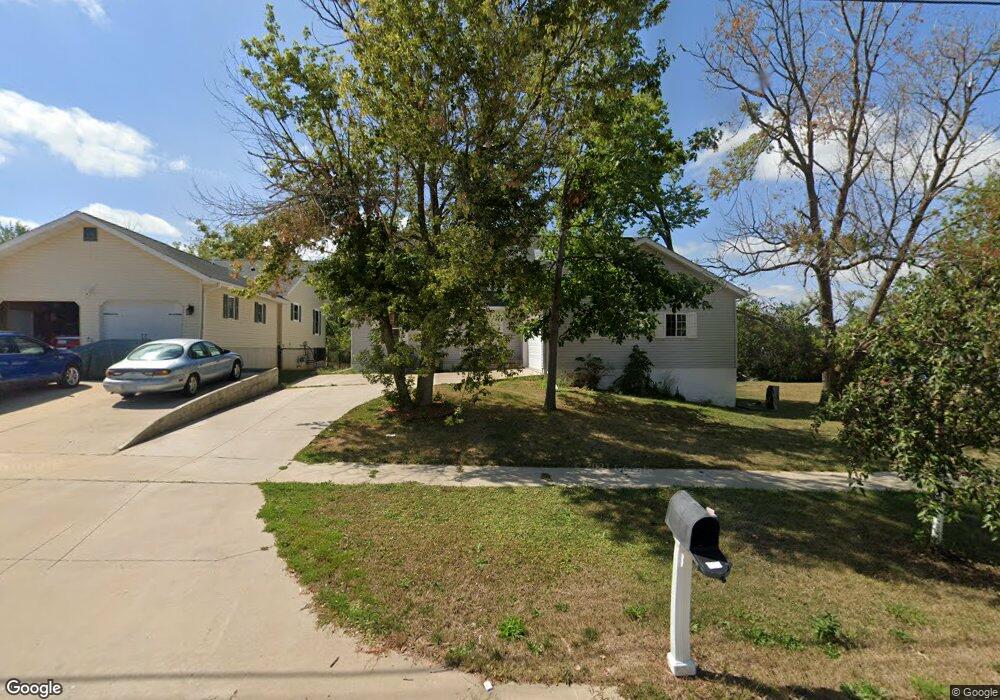
1930 18th St SW Cedar Rapids, IA 52404
Estimated Value: $262,000 - $332,000
3
Beds
3
Baths
2,323
Sq Ft
$132/Sq Ft
Est. Value
About This Home
This home is located at 1930 18th St SW, Cedar Rapids, IA 52404 and is currently estimated at $305,982, approximately $131 per square foot. 1930 18th St SW is a home located in Linn County with nearby schools including Junction City Elementary School, Perryville Elementary School, and Van Buren Elementary School.
Ownership History
Date
Name
Owned For
Owner Type
Purchase Details
Closed on
Jul 12, 2017
Sold by
Brian D Gardner
Bought by
Rollinger Jay
Current Estimated Value
Home Financials for this Owner
Home Financials are based on the most recent Mortgage that was taken out on this home.
Original Mortgage
$218,000
Outstanding Balance
$181,469
Interest Rate
3.96%
Estimated Equity
$124,513
Purchase Details
Closed on
Apr 18, 2017
Sold by
Us Bank Na
Bought by
Rollinger Jay
Purchase Details
Closed on
Jun 19, 2006
Sold by
Cerka David M and Cerka Sharon K
Bought by
Garner Joseph D and Garner Mary E
Home Financials for this Owner
Home Financials are based on the most recent Mortgage that was taken out on this home.
Original Mortgage
$147,900
Interest Rate
6.72%
Mortgage Type
Construction
Create a Home Valuation Report for This Property
The Home Valuation Report is an in-depth analysis detailing your home's value as well as a comparison with similar homes in the area
Home Values in the Area
Average Home Value in this Area
Purchase History
| Date | Buyer | Sale Price | Title Company |
|---|---|---|---|
| Rollinger Jay | $142,000 | -- | |
| Rollinger Jay | $142,000 | None Available | |
| Garner Joseph D | $34,500 | None Available |
Source: Public Records
Mortgage History
| Date | Status | Borrower | Loan Amount |
|---|---|---|---|
| Open | Rollinger Jay | $218,000 | |
| Closed | Rollinger Jay | -- | |
| Previous Owner | Garner Joseph D | $147,900 |
Source: Public Records
Tax History Compared to Growth
Tax History
| Year | Tax Paid | Tax Assessment Tax Assessment Total Assessment is a certain percentage of the fair market value that is determined by local assessors to be the total taxable value of land and additions on the property. | Land | Improvement |
|---|---|---|---|---|
| 2025 | $4,960 | $274,100 | $39,800 | $234,300 |
| 2024 | $5,282 | $271,400 | $35,000 | $236,400 |
| 2023 | $5,282 | $280,300 | $33,400 | $246,900 |
| 2022 | $4,932 | $250,400 | $33,400 | $217,000 |
| 2021 | $5,316 | $238,100 | $30,300 | $207,800 |
| 2020 | $5,316 | $240,900 | $25,500 | $215,400 |
| 2019 | $4,752 | $220,500 | $25,500 | $195,000 |
| 2018 | $4,622 | $220,500 | $25,500 | $195,000 |
| 2017 | $4,418 | $211,400 | $25,100 | $186,300 |
| 2016 | $4,433 | $208,600 | $25,100 | $183,500 |
| 2015 | $4,399 | $206,768 | $25,141 | $181,627 |
| 2014 | $4,214 | $205,194 | $25,141 | $180,053 |
| 2013 | $4,088 | $205,194 | $25,141 | $180,053 |
Source: Public Records
Map
Nearby Homes
- 1960 Rockford Rd SW Unit 45
- 2025 18th St SW
- 1801 Shady Grove Rd SW
- 2105 Milligan Ct SW
- 1806 Holly Meadow Ave SW
- 2150 Rockford Rd SW
- 1812 Holly Meadow Ave SW
- 1824 Holly Meadow Ave SW
- 1818 Holly Meadow Ave SW
- 2207 Shady Grove Rd SW
- 2126 Snapdragon Cir SW
- Remington - Cedar Rapids Plan at Whispering Pines
- Copeland Plan at Whispering Pines
- Meadowbrook - Cedar Rapids Plan at Stags Leap Estates
- Caldwell Plan at Stags Leap Estates
- Concord - Cedar Rapids Plan at Stags Leap Estates
- Yuma Expanded Plan at Whispering Pines
- Becker II Plan at Kirkwood Village - Kirk Wood Village
- Meadowbrook - Cedar Rapids Plan at Whispering Pines
- Richland Plan at Stags Leap Estates
- 1936 18th St SW
- 1918 18th St SW
- 2008 18th St SW
- 2014 18th St SW
- 1960 Rockford Rd SW Unit 47
- 1960 Rockford Rd SW
- 1960 Rockford Rd SW Unit 44
- 1960 Rockford Rd SW Unit 43
- 1960 Rockford Rd SW Unit 42
- 1960 Rockford Rd SW
- 1960 Rockford Rd SW Unit 40
- 1960 Rockford Rd SW Unit 39
- 1960 Rockford Rd SW Unit 38
- 1960 Rockford Rd SW
- 1960 Rockford Rd SW Unit 35
- 1960 Rockford Rd SW
- 1960 Rockford Rd SW
- 1960 Rockford Rd SW Unit 48
- 1960 Rockford Rd SW Unit 36
- 1960 Rockford Rd SW Unit 33