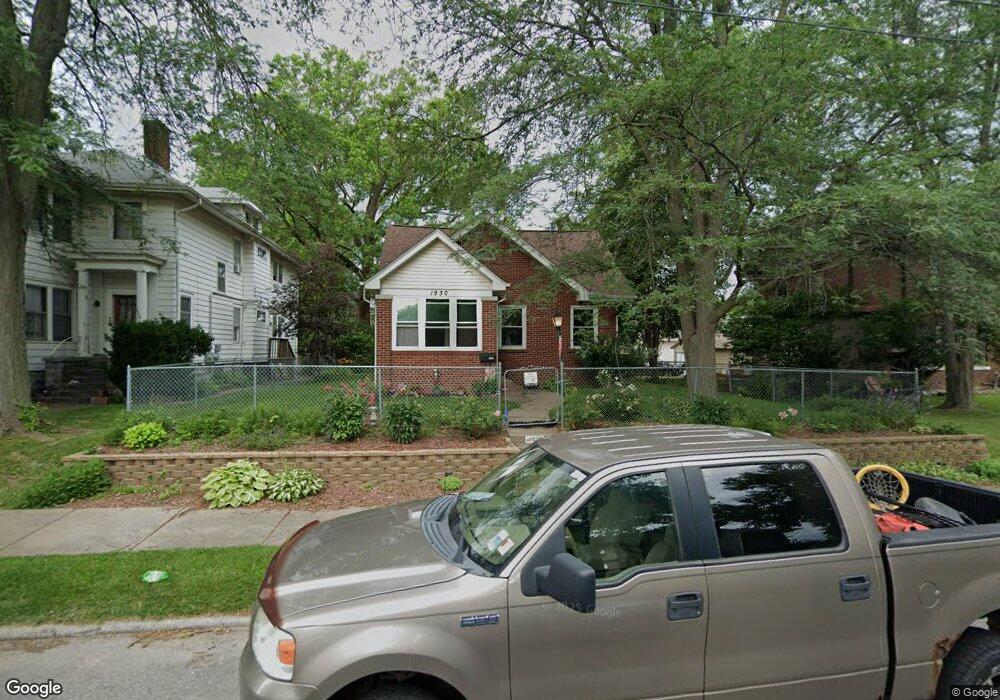
1930 Pershing Ave Davenport, IA 52803
Near North Side NeighborhoodEstimated Value: $179,000 - $210,000
4
Beds
3
Baths
1,891
Sq Ft
$105/Sq Ft
Est. Value
About This Home
This home is located at 1930 Pershing Ave, Davenport, IA 52803 and is currently estimated at $197,667, approximately $104 per square foot. 1930 Pershing Ave is a home located in Scott County with nearby schools including Crofton Elementary School, Christian County Day Treatment Center Alt, and Casey County Middle School.
Ownership History
Date
Name
Owned For
Owner Type
Purchase Details
Closed on
Feb 10, 2014
Sold by
Smith Richard G and Smith Gail P
Bought by
Smith Richard G and Smith Gail P
Current Estimated Value
Purchase Details
Closed on
Oct 18, 2012
Sold by
Smith Richard G and Smith Gail P
Bought by
Smith Richard G and Smith Gail P
Purchase Details
Closed on
Jan 19, 2006
Sold by
White Brian T
Bought by
Smith Richard G and Smith Gail P
Home Financials for this Owner
Home Financials are based on the most recent Mortgage that was taken out on this home.
Original Mortgage
$59,900
Outstanding Balance
$34,046
Interest Rate
6.46%
Mortgage Type
New Conventional
Estimated Equity
$163,621
Purchase Details
Closed on
Aug 31, 2005
Sold by
Spears Nora I
Bought by
White Brian T
Home Financials for this Owner
Home Financials are based on the most recent Mortgage that was taken out on this home.
Original Mortgage
$110,000
Interest Rate
6.2%
Mortgage Type
Future Advance Clause Open End Mortgage
Create a Home Valuation Report for This Property
The Home Valuation Report is an in-depth analysis detailing your home's value as well as a comparison with similar homes in the area
Home Values in the Area
Average Home Value in this Area
Purchase History
| Date | Buyer | Sale Price | Title Company |
|---|---|---|---|
| Smith Richard G | -- | None Available | |
| Smith Richard G | -- | None Available | |
| Smith Richard G | $135,000 | None Available | |
| White Brian T | $78,500 | None Available |
Source: Public Records
Mortgage History
| Date | Status | Borrower | Loan Amount |
|---|---|---|---|
| Open | Smith Richard G | $59,900 | |
| Previous Owner | White Brian T | $110,000 |
Source: Public Records
Tax History Compared to Growth
Tax History
| Year | Tax Paid | Tax Assessment Tax Assessment Total Assessment is a certain percentage of the fair market value that is determined by local assessors to be the total taxable value of land and additions on the property. | Land | Improvement |
|---|---|---|---|---|
| 2025 | $3,110 | $200,450 | $27,750 | $172,700 |
| 2024 | $2,918 | $184,200 | $27,750 | $156,450 |
| 2023 | $2,852 | $177,830 | $27,750 | $150,080 |
| 2022 | $2,700 | $142,360 | $21,450 | $120,910 |
| 2021 | $2,700 | $134,740 | $21,450 | $113,290 |
| 2020 | $2,686 | $132,470 | $21,450 | $111,020 |
| 2019 | $2,704 | $129,070 | $21,450 | $107,620 |
| 2018 | $2,644 | $129,070 | $21,450 | $107,620 |
| 2017 | $718 | $129,070 | $21,450 | $107,620 |
| 2016 | $2,636 | $129,070 | $0 | $0 |
| 2015 | $2,636 | $126,540 | $0 | $0 |
| 2014 | $2,616 | $126,490 | $0 | $0 |
| 2013 | $2,566 | $0 | $0 | $0 |
| 2012 | -- | $119,380 | $19,060 | $100,320 |
Source: Public Records
Map
Nearby Homes
- 1812 Pershing Ave
- 125 E Locust St
- 420 Kirkwood Blvd
- 325 Kirkwood Blvd
- 224 E Rusholme St
- 402 E Rusholme St
- 625 E High St
- 511 Kirkwood Blvd
- 618 Douglas Ct
- 2211 Farnam St
- 325 E Dover Ct
- 2307 Farnam St
- 320 E 14th St
- 1518 N Main St
- 1605 N Harrison St
- 2501 Brady St
- 407 E 14th St
- 409 E 14th St
- 2215 Grand Ave
- 637 E 15th St
- 1928 Pershing Ave
- 1932 Pershing Ave
- 1920 Pershing Ave
- 1936 Pershing Ave
- 1937 Virginia Ave
- 1931 Virginia Ave
- 1939 Virginia Ave
- 1933 Pershing Ave
- 1939 Pershing Ave
- 1921 Virginia Ave
- 1929 Pershing Ave
- 1916 Pershing Ave
- 1923 Pershing Ave
- 2005 Pershing Ave
- 1919 Pershing Ave
- 1915 Pershing Ave
- 1928 Virginia Ave
- 1932 Virginia Ave
- 234 E Pleasant St
- 240 E Pleasant St