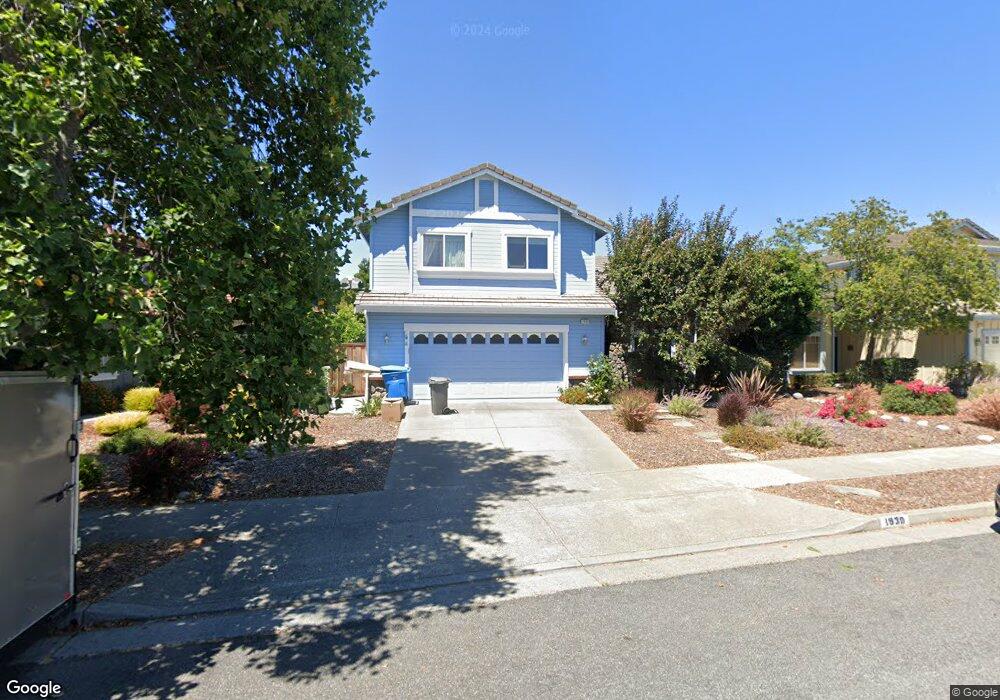
1930 Rainier Cir Petaluma, CA 94954
College Heights NeighborhoodEstimated Value: $1,043,293 - $1,211,000
4
Beds
3
Baths
2,386
Sq Ft
$471/Sq Ft
Est. Value
About This Home
This home is located at 1930 Rainier Cir, Petaluma, CA 94954 and is currently estimated at $1,123,323, approximately $470 per square foot. 1930 Rainier Cir is a home located in Sonoma County with nearby schools including Kenilworth Junior High School, Casa Grande High School, and Sonoma Mountain Elementary School.
Ownership History
Date
Name
Owned For
Owner Type
Purchase Details
Closed on
Oct 25, 2024
Sold by
Roy and Stacy
Bought by
Roy Stacy
Current Estimated Value
Purchase Details
Closed on
Apr 7, 2016
Sold by
Dibs John A and Dibs Irena S
Bought by
Stacy Roy Kaushik and Stacy Roy
Home Financials for this Owner
Home Financials are based on the most recent Mortgage that was taken out on this home.
Original Mortgage
$525,000
Interest Rate
3.62%
Mortgage Type
New Conventional
Purchase Details
Closed on
Oct 21, 2002
Sold by
Desmond Timothy G and Lord Diane M
Bought by
Dibs John A and Dibs Irena S
Home Financials for this Owner
Home Financials are based on the most recent Mortgage that was taken out on this home.
Original Mortgage
$365,000
Interest Rate
6.09%
Purchase Details
Closed on
Jul 21, 1993
Sold by
Mountain Valley Partners Ltd
Bought by
Desmond Timothy G and Lord Diane M
Create a Home Valuation Report for This Property
The Home Valuation Report is an in-depth analysis detailing your home's value as well as a comparison with similar homes in the area
Home Values in the Area
Average Home Value in this Area
Purchase History
| Date | Buyer | Sale Price | Title Company |
|---|---|---|---|
| Roy Stacy | -- | None Listed On Document | |
| Stacy Roy Kaushik | $725,000 | Fidelity National Title Co | |
| Dibs John A | $500,000 | First American Title Co | |
| Desmond Timothy G | $265,000 | First American Title Ins Co |
Source: Public Records
Mortgage History
| Date | Status | Borrower | Loan Amount |
|---|---|---|---|
| Previous Owner | Stacy Roy Kaushik | $525,000 | |
| Previous Owner | Dibs John A | $365,000 |
Source: Public Records
Tax History Compared to Growth
Tax History
| Year | Tax Paid | Tax Assessment Tax Assessment Total Assessment is a certain percentage of the fair market value that is determined by local assessors to be the total taxable value of land and additions on the property. | Land | Improvement |
|---|---|---|---|---|
| 2025 | $9,439 | $858,249 | $343,300 | $514,949 |
| 2024 | $9,439 | $841,421 | $336,569 | $504,852 |
| 2023 | $9,439 | $824,923 | $329,970 | $494,953 |
| 2022 | $9,223 | $808,749 | $323,500 | $485,249 |
| 2021 | $9,117 | $792,892 | $317,157 | $475,735 |
| 2020 | $9,181 | $784,762 | $313,905 | $470,857 |
| 2019 | $9,089 | $769,375 | $307,750 | $461,625 |
| 2018 | $8,825 | $754,290 | $301,716 | $452,574 |
| 2017 | $8,697 | $739,500 | $295,800 | $443,700 |
| 2016 | $7,059 | $611,741 | $226,341 | $385,400 |
| 2015 | $6,877 | $602,553 | $222,942 | $379,611 |
| 2014 | $6,421 | $557,000 | $206,000 | $351,000 |
Source: Public Records
Map
Nearby Homes
- 523 Greenwich St
- 402 Barons Way
- 104 Banff Way
- 529 Rosewood Cir
- 837 Vineyard Place
- 1622 Flanigan Way
- 1463 Woodside Cir
- 63 Oakwood Dr
- 71 Candlewood Dr
- 1441 Woodside Cir
- 1548 Royal Oak Dr
- 20 Oakwood Dr
- 116 Marvin Ct
- 3066 Adobe Rd
- 1757 Burgundy Ct
- 1544 Crown Rd
- 1407 Woodside Cir
- 628 Nikki Dr
- 112 Rose Petal Ct
- 1501 Florence Way
- 1926 Rainier Cir
- 1934 Rainier Cir
- 1909 Bristol St
- 1938 Rainier Cir
- 1922 Rainier Cir
- 1905 Bristol St
- 1913 Bristol St
- 525 Eagle St
- 1917 Bristol St
- 1942 Rainier Cir
- 526 Eagle St
- 521 Eagle St
- 584 Almanor St
- 1921 Bristol St
- 1946 Rainier Cir
- 522 Eagle St
- 1921 Rainier Cir
- 1910 Bristol St
- 1906 Bristol St
- 582 Almanor St