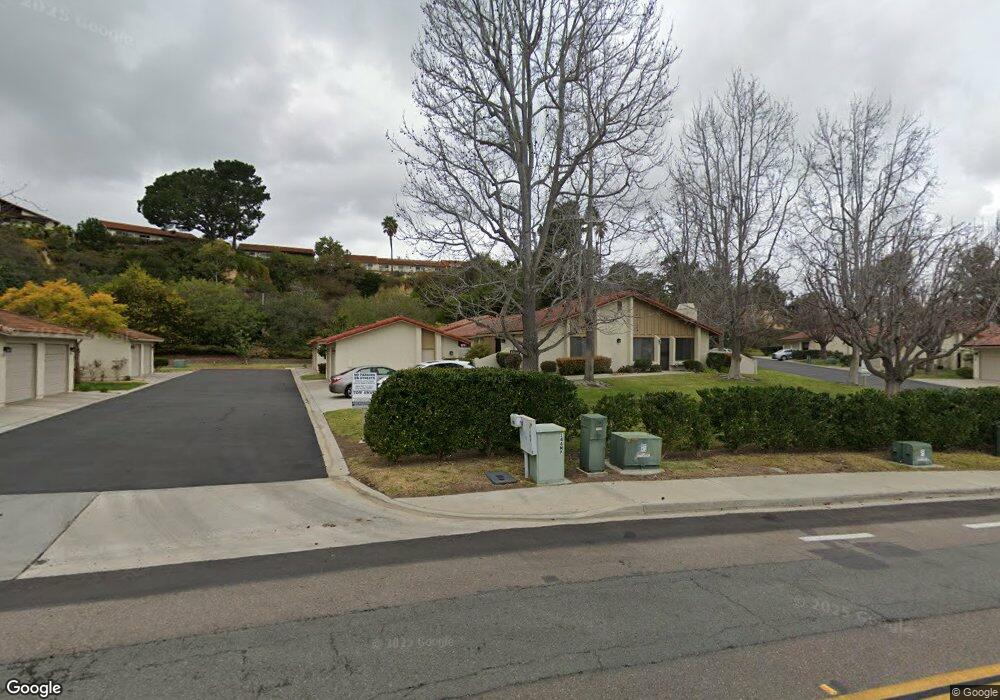
1930 Sandstone Vista Ln Unit 339 Encinitas, CA 92024
Central Encinitas NeighborhoodEstimated Value: $812,123 - $909,000
2
Beds
2
Baths
936
Sq Ft
$918/Sq Ft
Est. Value
About This Home
This home is located at 1930 Sandstone Vista Ln Unit 339, Encinitas, CA 92024 and is currently estimated at $859,031, approximately $917 per square foot. 1930 Sandstone Vista Ln Unit 339 is a home located in San Diego County with nearby schools including Park Dale Lane Elementary, Oak Crest Middle School, and La Costa Canyon High School.
Ownership History
Date
Name
Owned For
Owner Type
Purchase Details
Closed on
Jul 23, 2010
Sold by
Moldow Wendy S
Bought by
Lawson James M
Current Estimated Value
Home Financials for this Owner
Home Financials are based on the most recent Mortgage that was taken out on this home.
Original Mortgage
$208,000
Outstanding Balance
$138,150
Interest Rate
4.71%
Mortgage Type
Seller Take Back
Estimated Equity
$720,881
Purchase Details
Closed on
Aug 16, 2000
Sold by
Mcmillan Bill Trust 11-05-97 and Vanscoyoc Mary Van
Bought by
Moldow Wendy S
Home Financials for this Owner
Home Financials are based on the most recent Mortgage that was taken out on this home.
Original Mortgage
$127,500
Interest Rate
7.75%
Mortgage Type
Purchase Money Mortgage
Purchase Details
Closed on
Nov 5, 1997
Sold by
Mcmillan William W
Bought by
Mcmillan Bill
Purchase Details
Closed on
Dec 18, 1984
Create a Home Valuation Report for This Property
The Home Valuation Report is an in-depth analysis detailing your home's value as well as a comparison with similar homes in the area
Home Values in the Area
Average Home Value in this Area
Purchase History
| Date | Buyer | Sale Price | Title Company |
|---|---|---|---|
| Lawson James M | $275,000 | Fidelity National Title Co | |
| Moldow Wendy S | $170,000 | Commonwealth Land Title Co | |
| Mcmillan Bill | -- | -- | |
| -- | $94,400 | -- |
Source: Public Records
Mortgage History
| Date | Status | Borrower | Loan Amount |
|---|---|---|---|
| Open | Lawson James M | $208,000 | |
| Previous Owner | Moldow Wendy S | $127,500 |
Source: Public Records
Tax History Compared to Growth
Tax History
| Year | Tax Paid | Tax Assessment Tax Assessment Total Assessment is a certain percentage of the fair market value that is determined by local assessors to be the total taxable value of land and additions on the property. | Land | Improvement |
|---|---|---|---|---|
| 2025 | $4,278 | $352,310 | $110,953 | $241,357 |
| 2024 | $4,278 | $345,403 | $108,778 | $236,625 |
| 2023 | $4,133 | $338,632 | $106,646 | $231,986 |
| 2022 | $4,018 | $331,993 | $104,555 | $227,438 |
| 2021 | $3,935 | $325,484 | $102,505 | $222,979 |
| 2020 | $3,857 | $322,147 | $101,454 | $220,693 |
| 2019 | $3,784 | $315,831 | $99,465 | $216,366 |
| 2018 | $3,726 | $309,639 | $97,515 | $212,124 |
| 2017 | $3,665 | $303,568 | $95,603 | $207,965 |
| 2016 | $3,559 | $297,617 | $93,729 | $203,888 |
| 2015 | $3,484 | $293,148 | $92,322 | $200,826 |
| 2014 | $3,393 | $287,407 | $90,514 | $196,893 |
Source: Public Records
Map
Nearby Homes
- 1926 Springdale Ln
- 1829 Forestdale Dr
- 220 S Shorehang Ln
- 1741 Charleston Ln
- 1716 Kellington Place
- 277 Via Del Cerrito
- 155 Countrywood Ln
- 2005 Countrywood Ct
- 1824 Eastwood Ln
- 1583 Avenida de Los Lirios Unit A
- 1838 Stonebrook Ln
- 339 Rancho Santa fe Rd
- 608 Crest Dr
- 1785 Caliban Dr
- 4149 Manchester Ave
- 1709 Edgefield Ln
- 1617 Blossom Field Way
- 1429 Trabert Ranch Rd
- 1103 Calle Christopher
- 612 Lucylle Ln
- 1904 Sandstone Vista Ln
- 1956 Sandstone Vista Ln
- 1982 Sandstone Vista Ln
- 1905 Sandstone Vista Ln
- 1931 Sandstone Vista Ln Unit 334
- 1957 Sandstone Vista Ln
- 1983 Sandstone Vista Ln
- 1944 Irisdale Ct
- 1972 Irisdale Ct
- 1958 Irisdale Ct
- 1930 Irisdale Ct
- 1916 Irisdale Ct
- 1986 Irisdale Ct Unit 347
- 1902 Irisdale Ct
- 1906 Springdale Ln
- 1840 Forestdale Dr
- 1902 Springdale Ln
- 1846 Forestdale Dr
- 1842 Forestdale Dr
- 1850 Forestdale Dr