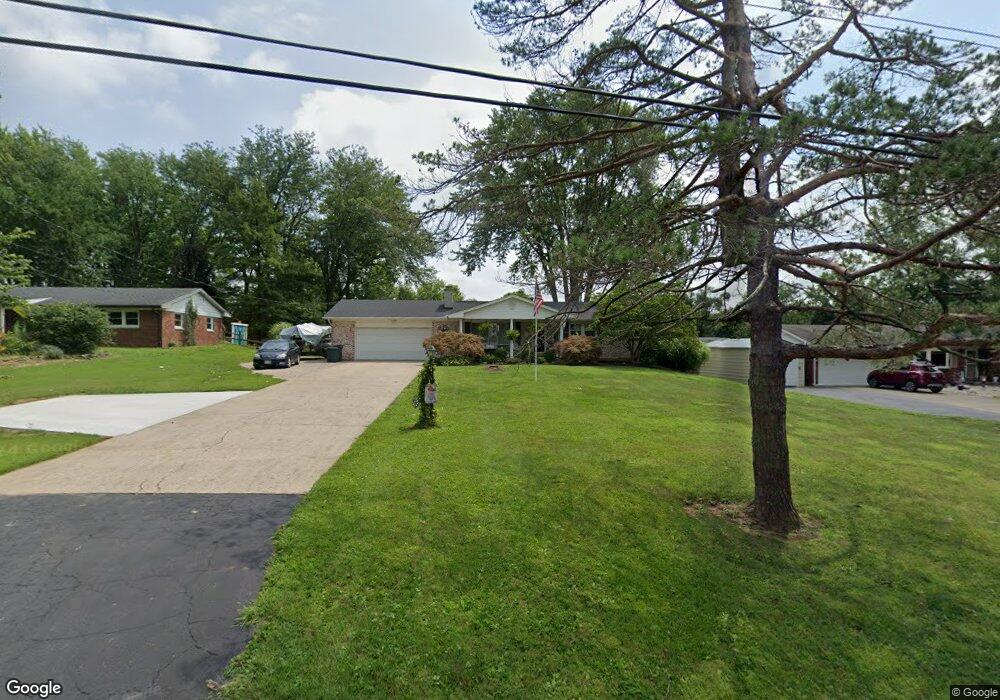
1930 Union Rd Middletown, OH 45044
Estimated Value: $295,385 - $322,000
3
Beds
2
Baths
1,530
Sq Ft
$202/Sq Ft
Est. Value
About This Home
This home is located at 1930 Union Rd, Middletown, OH 45044 and is currently estimated at $309,596, approximately $202 per square foot. 1930 Union Rd is a home located in Warren County with nearby schools including Bowman Primary School, Berry Intermediate School, and Donovan Elementary School.
Ownership History
Date
Name
Owned For
Owner Type
Purchase Details
Closed on
Jan 7, 2010
Sold by
Campbell Angel D
Bought by
Campbell John S
Current Estimated Value
Home Financials for this Owner
Home Financials are based on the most recent Mortgage that was taken out on this home.
Original Mortgage
$115,500
Outstanding Balance
$73,638
Interest Rate
4.78%
Mortgage Type
New Conventional
Estimated Equity
$235,958
Purchase Details
Closed on
Feb 2, 2004
Sold by
Brown Connie L
Bought by
Campbell John S and Campbell Angel D
Home Financials for this Owner
Home Financials are based on the most recent Mortgage that was taken out on this home.
Original Mortgage
$194,800
Outstanding Balance
$85,745
Interest Rate
5.5%
Mortgage Type
Purchase Money Mortgage
Estimated Equity
$223,851
Purchase Details
Closed on
Feb 17, 1984
Sold by
Shackelford Lawrence R and Shackelford Lawrence R
Bought by
Brown and Brown Gary A
Purchase Details
Closed on
Jun 1, 1979
Sold by
Duff Duff and Duff Douglas A
Create a Home Valuation Report for This Property
The Home Valuation Report is an in-depth analysis detailing your home's value as well as a comparison with similar homes in the area
Home Values in the Area
Average Home Value in this Area
Purchase History
| Date | Buyer | Sale Price | Title Company |
|---|---|---|---|
| Campbell John S | -- | All Points Title | |
| Campbell John S | $148,500 | Midland Title Security Inc | |
| Brown | $53,900 | -- | |
| -- | $61,100 | -- |
Source: Public Records
Mortgage History
| Date | Status | Borrower | Loan Amount |
|---|---|---|---|
| Open | Campbell John S | $115,500 | |
| Open | Campbell John S | $194,800 |
Source: Public Records
Tax History
| Year | Tax Paid | Tax Assessment Tax Assessment Total Assessment is a certain percentage of the fair market value that is determined by local assessors to be the total taxable value of land and additions on the property. | Land | Improvement |
|---|---|---|---|---|
| 2025 | $3,120 | $78,520 | $20,850 | $57,670 |
| 2024 | $3,120 | $78,520 | $20,850 | $57,670 |
| 2023 | $2,764 | $62,828 | $11,658 | $51,170 |
| 2022 | $2,729 | $62,829 | $11,659 | $51,170 |
| 2021 | $2,532 | $62,829 | $11,659 | $51,170 |
| 2020 | $2,472 | $51,079 | $9,478 | $41,601 |
| 2019 | $2,486 | $51,079 | $9,478 | $41,601 |
| 2018 | $2,241 | $51,079 | $9,478 | $41,601 |
| 2017 | $2,258 | $46,116 | $8,694 | $37,422 |
| 2016 | $2,334 | $46,116 | $8,694 | $37,422 |
| 2015 | $2,353 | $46,116 | $8,694 | $37,422 |
| 2014 | $2,220 | $41,550 | $7,830 | $33,710 |
| 2013 | $2,213 | $50,270 | $9,480 | $40,790 |
Source: Public Records
Map
Nearby Homes
- Lot 3 Greentree Rd
- 2437 Trinity Dr
- 0 Greentree Rd Unit 934072
- 6710 Hendrickson Rd
- Lot 1 Greentree Rd
- Lot 2 Greentree Rd
- 1251 Barton Ln
- 415 Brandon Dunes Ct Unit 12-202
- 415 Brandon Dunes Ct
- 423 Chambers Bay Place
- 423 Chambers Bay Place Unit 13-102
- 431 Chambers Bay Place Unit 13-203
- 431 Chambers Bay Place
- 5324 Donatello Dr
- 1702 Penelope Place
- 1767 Penelope Place
- 1492 Red Hawk Ct
- 1759 Penelope Place
- 1755 Penelope Place
- 1723 Penelope Place
Your Personal Tour Guide
Ask me questions while you tour the home.