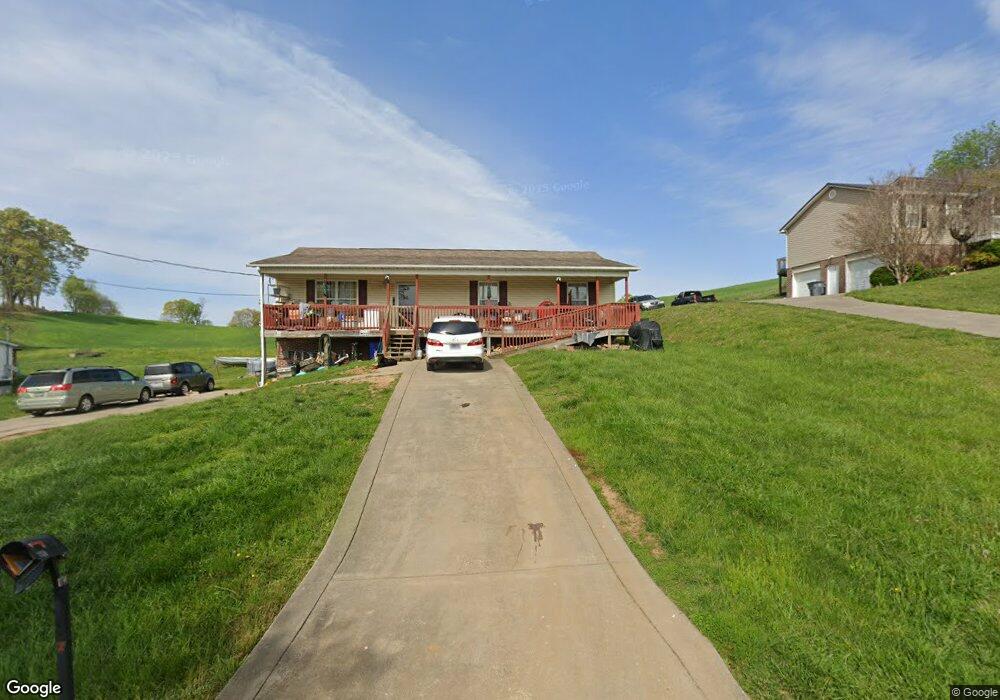
1930 Waldo Dr Morristown, TN 37813
Estimated Value: $271,512 - $367,000
3
Beds
2
Baths
1,344
Sq Ft
$235/Sq Ft
Est. Value
About This Home
This home is located at 1930 Waldo Dr, Morristown, TN 37813 and is currently estimated at $316,378, approximately $235 per square foot. 1930 Waldo Dr is a home located in Hamblen County with nearby schools including Witt Elementary School, Lincoln Heights Middle School, and Morristown West High School.
Ownership History
Date
Name
Owned For
Owner Type
Purchase Details
Closed on
Aug 29, 2025
Sold by
Lakins Brad A and Lakins Leslie A
Bought by
Torres Pagan Zuleika and Benitez Angel Cristian
Current Estimated Value
Home Financials for this Owner
Home Financials are based on the most recent Mortgage that was taken out on this home.
Original Mortgage
$87,629
Outstanding Balance
$87,629
Interest Rate
6.74%
Mortgage Type
FHA
Estimated Equity
$228,749
Purchase Details
Closed on
Nov 7, 2007
Sold by
Kay Robert P H
Bought by
Lakins Brad A
Purchase Details
Closed on
Aug 10, 2006
Sold by
Leinart Joe E
Bought by
Kay Robert P H
Purchase Details
Closed on
Jul 4, 2006
Bought by
Kay Robert P H and Poole Nancy
Purchase Details
Closed on
Aug 16, 1985
Bought by
Schwartz Kathleen and Wheeler Betty R
Purchase Details
Closed on
Dec 7, 1966
Bought by
Cheek Cheek W and Cheek Retta V
Create a Home Valuation Report for This Property
The Home Valuation Report is an in-depth analysis detailing your home's value as well as a comparison with similar homes in the area
Home Values in the Area
Average Home Value in this Area
Purchase History
| Date | Buyer | Sale Price | Title Company |
|---|---|---|---|
| Torres Pagan Zuleika | $89,246 | Colonial Title Group | |
| Lakins Brad A | $10,000 | -- | |
| Kay Robert P H | $31,157 | -- | |
| Kay Robert P H | $31,200 | -- | |
| Schwartz Kathleen | -- | -- | |
| Cheek Cheek W | -- | -- |
Source: Public Records
Mortgage History
| Date | Status | Borrower | Loan Amount |
|---|---|---|---|
| Open | Torres Pagan Zuleika | $87,629 |
Source: Public Records
Tax History Compared to Growth
Tax History
| Year | Tax Paid | Tax Assessment Tax Assessment Total Assessment is a certain percentage of the fair market value that is determined by local assessors to be the total taxable value of land and additions on the property. | Land | Improvement |
|---|---|---|---|---|
| 2024 | $683 | $34,650 | $4,075 | $30,575 |
| 2023 | $683 | $34,650 | $0 | $0 |
| 2022 | $683 | $34,650 | $4,075 | $30,575 |
| 2021 | $683 | $34,650 | $4,075 | $30,575 |
| 2020 | $683 | $34,650 | $4,075 | $30,575 |
| 2019 | $676 | $31,725 | $3,500 | $28,225 |
| 2018 | $676 | $31,725 | $3,500 | $28,225 |
| 2017 | $676 | $31,725 | $3,500 | $28,225 |
| 2016 | $631 | $31,725 | $3,500 | $28,225 |
| 2015 | $587 | $31,725 | $3,500 | $28,225 |
| 2014 | -- | $31,725 | $3,500 | $28,225 |
| 2013 | -- | $35,850 | $0 | $0 |
Source: Public Records
Map
Nearby Homes
- 1708 Hindley Rd
- 2895 Coffey Rd
- 2018 Southwood Cir
- 1049 Greenway Dr
- Darwin Plan at Southwood
- Robie Plan at Southwood
- Elston Plan at Southwood
- Belhaven Plan at Southwood
- Penwell Plan at Southwood
- Cali Plan at Southwood
- 672 Shadow Ln
- 1418 Mae Collins Rd
- 2262 Fernwood Church Rd
- 1160 Statem Gap Rd
- 3520 Sublett Rd
- 3434 Maple Valle Rd
- 0 Alpha Valley Home Rd Unit 709093
- 453 Statem Gap Rd
- 490 E Sunset Hills
- 440 S Fairmont Ave
- 1892 Waldo Dr
- 1928 Waldo Dr
- 1870 Waldo Dr
- 1893 Waldo Dr
- 0 Harley Rd
- 1854 Waldo Dr
- 3005 Harley Rd
- 3019 Harley Rd
- 1848 Waldo Dr
- 2989 Harley Rd
- 3025 Harley Rd
- 2975 Harley Rd
- 1825 Waldo Dr
- 1870 Mineral Hills Rd
- 2965 Harley Rd
- 1820 Waldo Dr Unit S/D Cheek Prop
- 1820 Waldo Dr
- 1921 Mineral Hills Rd
- 2985 Vine Rd
- 2995 Vine Rd