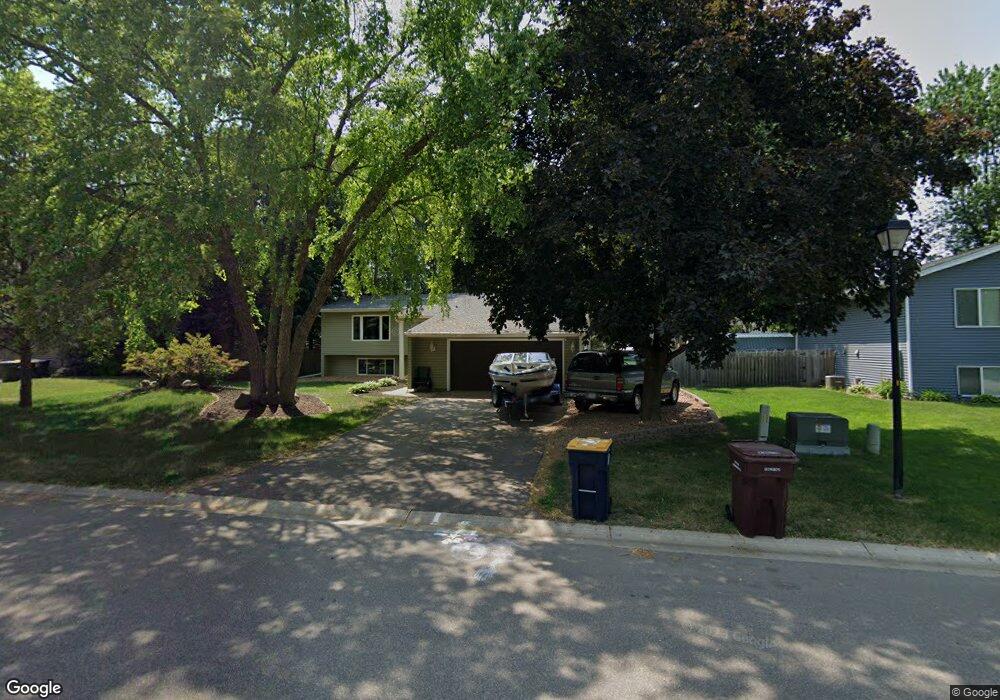
19305 Eureka Ave W Farmington, MN 55024
Estimated Value: $390,000 - $412,206
4
Beds
3
Baths
2,528
Sq Ft
$160/Sq Ft
Est. Value
About This Home
This home is located at 19305 Eureka Ave W, Farmington, MN 55024 and is currently estimated at $404,802, approximately $160 per square foot. 19305 Eureka Ave W is a home located in Dakota County with nearby schools including Meadowview Elementary School, Robert Boeckman Middle School, and Farmington High School.
Ownership History
Date
Name
Owned For
Owner Type
Purchase Details
Closed on
Oct 9, 2020
Sold by
Hall Chad T and Hall Tara
Bought by
Scott Anthony James and Scott Sarah
Current Estimated Value
Home Financials for this Owner
Home Financials are based on the most recent Mortgage that was taken out on this home.
Original Mortgage
$246,800
Outstanding Balance
$219,115
Interest Rate
2.8%
Mortgage Type
New Conventional
Estimated Equity
$185,687
Purchase Details
Closed on
Aug 24, 2011
Sold by
Bank Of America Na
Bought by
Federal Home Loan Mortgage Corporation
Home Financials for this Owner
Home Financials are based on the most recent Mortgage that was taken out on this home.
Original Mortgage
$94,138
Interest Rate
4.37%
Mortgage Type
FHA
Purchase Details
Closed on
Jul 29, 2011
Sold by
Federal Home Loan Mortgage Corporation
Bought by
Hall Chad T
Home Financials for this Owner
Home Financials are based on the most recent Mortgage that was taken out on this home.
Original Mortgage
$94,138
Interest Rate
4.37%
Mortgage Type
FHA
Create a Home Valuation Report for This Property
The Home Valuation Report is an in-depth analysis detailing your home's value as well as a comparison with similar homes in the area
Home Values in the Area
Average Home Value in this Area
Purchase History
| Date | Buyer | Sale Price | Title Company |
|---|---|---|---|
| Scott Anthony James | $308,500 | Bankers Title | |
| Federal Home Loan Mortgage Corporation | -- | Dca Title | |
| Hall Chad T | -- | Dca Title |
Source: Public Records
Mortgage History
| Date | Status | Borrower | Loan Amount |
|---|---|---|---|
| Open | Scott Anthony James | $246,800 | |
| Previous Owner | Hall Chad T | $94,138 |
Source: Public Records
Tax History Compared to Growth
Tax History
| Year | Tax Paid | Tax Assessment Tax Assessment Total Assessment is a certain percentage of the fair market value that is determined by local assessors to be the total taxable value of land and additions on the property. | Land | Improvement |
|---|---|---|---|---|
| 2024 | $4,532 | $366,500 | $91,300 | $275,200 |
| 2023 | $4,532 | $375,100 | $91,500 | $283,600 |
| 2022 | $4,082 | $355,400 | $85,700 | $269,700 |
| 2021 | $4,188 | $295,400 | $74,500 | $220,900 |
| 2020 | $3,966 | $299,900 | $71,000 | $228,900 |
| 2019 | $3,854 | $275,300 | $67,600 | $207,700 |
| 2018 | $3,694 | $263,600 | $64,400 | $199,200 |
| 2017 | $3,322 | $246,700 | $61,300 | $185,400 |
| 2016 | $3,420 | $219,100 | $58,400 | $160,700 |
| 2015 | $3,111 | $201,252 | $51,877 | $149,375 |
| 2014 | -- | $193,295 | $47,981 | $145,314 |
| 2013 | -- | $142,392 | $40,782 | $101,610 |
Source: Public Records
Map
Nearby Homes
- 19353 Eureka Ct
- 19158 Everest Path
- 19432 Everfield Ave
- 19380 Everfield Ave
- 19265 Everfield Ave
- 19145 Euclid Path
- 19241 Everfield Ave
- 19313 Everfield Ave
- 19440 Everglade Path
- 19325 Everfield Ave
- 19499 Everfield Ave
- The Cypress Plan at Meadowview Preserve - Main-Level Living Villa Homes
- The Cedar Plan at Meadowview Preserve - Main-Level Living Villa Homes
- The Spruce Plan at Meadowview Preserve - Main-Level Living Villa Homes
- The Sycamore Plan at Meadowview Preserve - Main-Level Living Villa Homes
- 19600 Estes Path
- 19461 Everglade Path
- 19110 Euclid Path
- 19380 Everglade Path
- 19410 Everglade Path
- 19289 Eureka Ave W
- 19319 Eureka Ave W
- 19320 Evening Star Way
- 19314 Evening Star Way
- 19328 Evening Star Way
- 19310 Eureka Ave W
- 19275 Eureka Ave W
- 19335 Eureka Ave W
- 19306 Evening Star Way
- 19334 Evening Star Way
- 19330 Eureka Ave W
- 19339 Eureka Ct
- 19290 Eureka Ave W
- 19342 Evening Star Way
- 19350 Eureka Ave W
- 19317 Evening Star Way
- 5710 5710 193rd-Street-w
- 5710 193rd St W
- 5794 193rd St W
- 19325 Evening Star Way