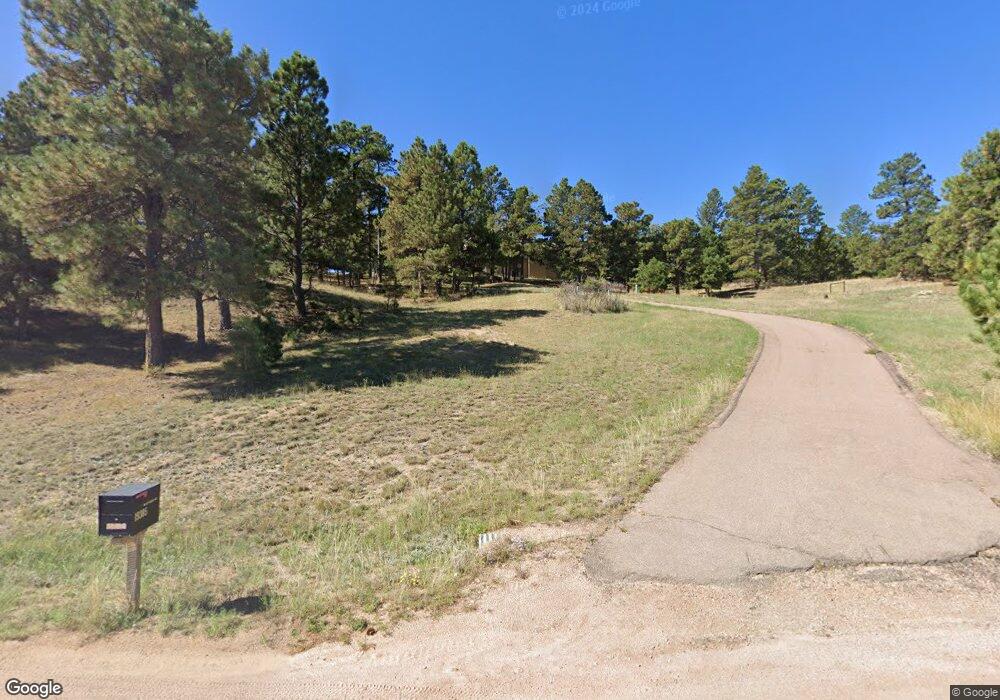
19305 Pinon Park Rd Peyton, CO 80831
Estimated Value: $696,000 - $730,000
2
Beds
3
Baths
1,807
Sq Ft
$398/Sq Ft
Est. Value
About This Home
This home is located at 19305 Pinon Park Rd, Peyton, CO 80831 and is currently estimated at $718,387, approximately $397 per square foot. 19305 Pinon Park Rd is a home located in El Paso County with nearby schools including Peyton Elementary School, Southeast Middle School, and Peyton Senior High School.
Ownership History
Date
Name
Owned For
Owner Type
Purchase Details
Closed on
Nov 12, 2013
Sold by
Dme Homes Inc
Bought by
Soraoka Edward G and Soraoka Karen K
Current Estimated Value
Home Financials for this Owner
Home Financials are based on the most recent Mortgage that was taken out on this home.
Original Mortgage
$388,406
Outstanding Balance
$290,227
Interest Rate
4.28%
Mortgage Type
VA
Estimated Equity
$428,160
Purchase Details
Closed on
Jun 24, 2013
Sold by
Baker Dennis H
Bought by
Dme Homes Inc
Purchase Details
Closed on
Oct 30, 1993
Sold by
Lentz Richard E and Lentz Cynthia M
Bought by
Baker Dennis H
Home Financials for this Owner
Home Financials are based on the most recent Mortgage that was taken out on this home.
Original Mortgage
$8,775
Interest Rate
6.96%
Purchase Details
Closed on
Apr 12, 1982
Bought by
Soraoka Karen K
Create a Home Valuation Report for This Property
The Home Valuation Report is an in-depth analysis detailing your home's value as well as a comparison with similar homes in the area
Home Values in the Area
Average Home Value in this Area
Purchase History
| Date | Buyer | Sale Price | Title Company |
|---|---|---|---|
| Soraoka Edward G | $375,999 | Fidelity National Title Insu | |
| Dme Homes Inc | $82,500 | Unified Title Company | |
| Baker Dennis H | $11,700 | Security Title | |
| Soraoka Karen K | -- | -- |
Source: Public Records
Mortgage History
| Date | Status | Borrower | Loan Amount |
|---|---|---|---|
| Open | Soraoka Edward G | $388,406 | |
| Previous Owner | Baker Dennis H | $8,775 |
Source: Public Records
Tax History Compared to Growth
Tax History
| Year | Tax Paid | Tax Assessment Tax Assessment Total Assessment is a certain percentage of the fair market value that is determined by local assessors to be the total taxable value of land and additions on the property. | Land | Improvement |
|---|---|---|---|---|
| 2025 | $1,855 | $49,770 | -- | -- |
| 2024 | $1,693 | $47,870 | $11,740 | $36,130 |
| 2023 | $1,693 | $47,870 | $11,740 | $36,130 |
| 2022 | $1,851 | $40,750 | $8,230 | $32,520 |
| 2021 | $1,984 | $41,930 | $8,470 | $33,460 |
| 2020 | $1,660 | $34,090 | $7,120 | $26,970 |
| 2019 | $1,633 | $34,090 | $7,120 | $26,970 |
| 2018 | $1,405 | $28,550 | $7,160 | $21,390 |
| 2017 | $1,396 | $28,550 | $7,160 | $21,390 |
| 2016 | $1,354 | $27,630 | $7,560 | $20,070 |
| 2015 | $1,349 | $27,630 | $7,560 | $20,070 |
| 2014 | $1,324 | $26,820 | $7,560 | $19,260 |
Source: Public Records
Map
Nearby Homes
- 18230 Cumbres Ct
- 18150 Pinon Park Rd
- 18150 Pinon Park Rd Unit 199
- 17814 Pinon Park Rd
- 17825 Pinon Park Rd
- 17882 Gray Mare Ln
- 19250 Ramrod Dr
- 17475 Cleese Ct
- 15345 Trigger Rd
- 16540 Mesquite Rd
- 17095 Red Barn Rd Unit Lot 7
- 17090 Red Barn Rd
- 17370 Sweet Rd
- 17015 Red Barn Rd Unit Lot 6
- 15550 Atlas Loop
- 16775 Fannin Cir
- 22350 Roxie Ridge View
- 18885 Prairie Breeze Point
- 19650 Saddle Blanket Ln
- 16535 Sweet Rd
- 19350 Pinon Park Rd
- 19205 Pinon Park Rd
- 17325 Prospector Dr
- 19250 Pinon Park Rd
- 17320 Peyton Hwy
- 17315 Prospector Dr
- 17320 Prospector Dr
- 19190 Pinon Park Rd
- 19175 Pinon Park Rd
- 17250 Prospector Dr
- 17155 Prospector Dr
- 17405 Prospector Dr
- 19220 Pinon Park Rd
- 17310 Prospector Dr
- 17410 Prospector Dr
- 17210 Prospector Dr
- 17825 Plains Edge Ct
- 19050 Pinon Park Rd
- 17810 Plains Edge Ct
- 17150 Prospector Dr