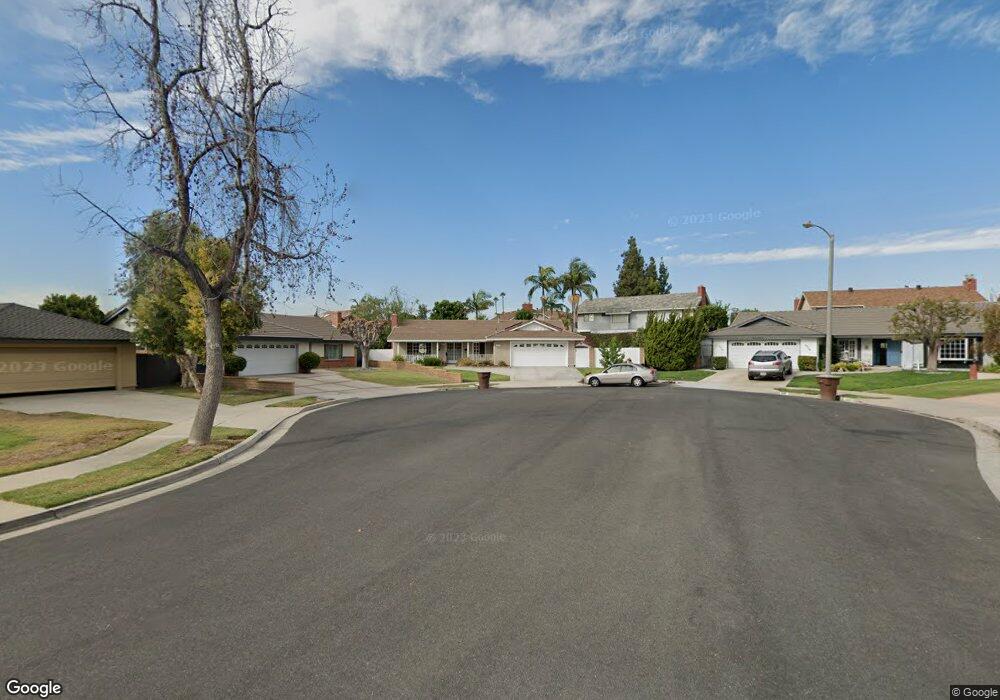
1931 Winney Cir Placentia, CA 92870
Estimated Value: $1,054,000 - $1,113,000
3
Beds
2
Baths
1,446
Sq Ft
$752/Sq Ft
Est. Value
About This Home
This home is located at 1931 Winney Cir, Placentia, CA 92870 and is currently estimated at $1,086,876, approximately $751 per square foot. 1931 Winney Cir is a home located in Orange County with nearby schools including Brookhaven Elementary School, Col. J. K. Tuffree Middle School, and El Dorado High School.
Ownership History
Date
Name
Owned For
Owner Type
Purchase Details
Closed on
Jun 1, 2016
Sold by
Porter Anne Harrington
Bought by
Porter Anne Harrington and Anne Harrington Porter Living Trust
Current Estimated Value
Purchase Details
Closed on
Nov 20, 1996
Sold by
Federal Home Loan Mortgage Corporation
Bought by
Harrington Porter Paula and Harrington Porter Anne
Home Financials for this Owner
Home Financials are based on the most recent Mortgage that was taken out on this home.
Original Mortgage
$162,750
Outstanding Balance
$15,785
Interest Rate
7.91%
Estimated Equity
$1,071,091
Purchase Details
Closed on
Aug 19, 1996
Sold by
Gmac Mtg Corp Of Pa
Bought by
Federal Home Loan Mortgage Corporation
Purchase Details
Closed on
Aug 14, 1996
Sold by
Baldridge Paul N and Baldridge Cheryl A
Bought by
Gmac Mtg Corp Of Pa
Create a Home Valuation Report for This Property
The Home Valuation Report is an in-depth analysis detailing your home's value as well as a comparison with similar homes in the area
Home Values in the Area
Average Home Value in this Area
Purchase History
| Date | Buyer | Sale Price | Title Company |
|---|---|---|---|
| Porter Anne Harrington | -- | None Available | |
| Harrington Porter Paula | $217,000 | Orange Coast Title | |
| Federal Home Loan Mortgage Corporation | -- | First American Title Ins Co | |
| Gmac Mtg Corp Of Pa | $203,019 | First American Title Ins Co |
Source: Public Records
Mortgage History
| Date | Status | Borrower | Loan Amount |
|---|---|---|---|
| Open | Harrington Porter Paula | $162,750 | |
| Closed | Harrington Porter Paula | $32,550 |
Source: Public Records
Tax History
| Year | Tax Paid | Tax Assessment Tax Assessment Total Assessment is a certain percentage of the fair market value that is determined by local assessors to be the total taxable value of land and additions on the property. | Land | Improvement |
|---|---|---|---|---|
| 2025 | $4,479 | $353,410 | $226,612 | $126,798 |
| 2024 | $4,479 | $346,481 | $222,169 | $124,312 |
| 2023 | $4,369 | $339,688 | $217,813 | $121,875 |
| 2022 | $4,283 | $333,028 | $213,542 | $119,486 |
| 2021 | $4,161 | $326,499 | $209,355 | $117,144 |
| 2020 | $4,172 | $323,152 | $207,209 | $115,943 |
| 2019 | $3,999 | $316,816 | $203,146 | $113,670 |
| 2018 | $3,944 | $310,604 | $199,162 | $111,442 |
| 2017 | $3,875 | $304,514 | $195,257 | $109,257 |
| 2016 | $3,797 | $298,544 | $191,429 | $107,115 |
| 2015 | $3,745 | $294,060 | $188,553 | $105,507 |
| 2014 | $3,642 | $288,300 | $184,859 | $103,441 |
Source: Public Records
Map
Nearby Homes
- 1837 Kelleher Place
- 1719 Pecos River
- 320 Purdy Ave
- 237 Bagnall Ave
- 455 Purdy Ave
- 1714 Kingston Rd
- 230 Gila Way
- 1525 Rogue St
- 1714 Sierra Bonita Dr
- 2317 Mohican Ave
- 206 Allegheny Cir
- 213 Appalachian Cir
- 1410 Via Cortez
- 3016 Clearwood Ct
- 2454 Beacon St
- 2123 Earnshaw Dr
- 3110 E Palm Dr Unit 14
- 2232 California St
- 4582 Jeanean Ln
- 5142 Hamer Ln
- 1925 Winney Cir
- 362 Wilcox Way
- 1932 Winney Cir
- 1945 Wilcox Cir
- 1919 Winney Cir
- 1926 Edwardson Cir
- 1968 Thomas Cir
- 368 Wilcox Way
- 1932 Edwardson Cir
- 1974 Thomas Cir
- 1920 Edwardson Cir
- 1920 Winney Cir
- 374 Wilcox Way
- 1980 Thomas Cir
- 1914 Winney Cir
- 1931 Brookhaven Ave
- 1925 Brookhaven Ave
- 1950 Wilcox Cir
- 320 Sarah Ave
- 1931 Edwardson Cir
Your Personal Tour Guide
Ask me questions while you tour the home.