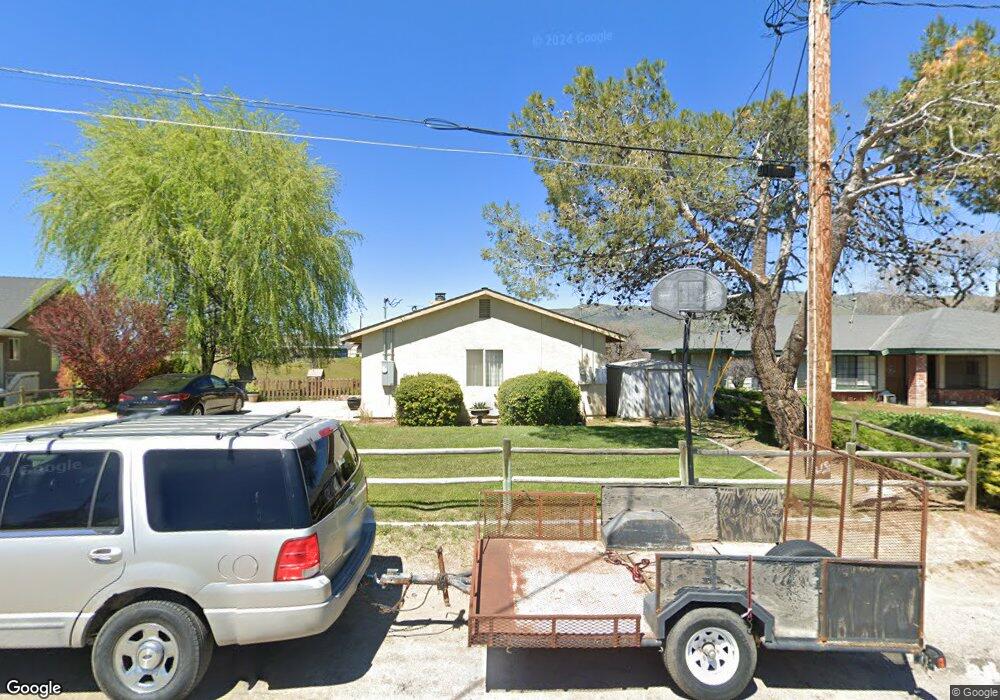
19313 Moon Dr Tehachapi, CA 93561
Estimated Value: $350,110 - $399,000
4
Beds
2
Baths
1,368
Sq Ft
$274/Sq Ft
Est. Value
About This Home
This home is located at 19313 Moon Dr, Tehachapi, CA 93561 and is currently estimated at $374,778, approximately $273 per square foot. 19313 Moon Dr is a home located in Kern County with nearby schools including Golden Hills Elementary School, Jacobsen Middle School, and Tehachapi High School.
Ownership History
Date
Name
Owned For
Owner Type
Purchase Details
Closed on
Mar 3, 2003
Sold by
Blount Nikki
Bought by
Blount Craig
Current Estimated Value
Home Financials for this Owner
Home Financials are based on the most recent Mortgage that was taken out on this home.
Original Mortgage
$128,089
Interest Rate
5.72%
Mortgage Type
FHA
Purchase Details
Closed on
Feb 20, 2003
Sold by
Byars John and Byars Johann
Bought by
Blount Craig
Home Financials for this Owner
Home Financials are based on the most recent Mortgage that was taken out on this home.
Original Mortgage
$128,089
Interest Rate
5.72%
Mortgage Type
FHA
Purchase Details
Closed on
Sep 5, 2001
Sold by
Pourghahreman Tracy A
Bought by
Byars John and Byars Johann
Home Financials for this Owner
Home Financials are based on the most recent Mortgage that was taken out on this home.
Original Mortgage
$106,590
Interest Rate
6.99%
Mortgage Type
VA
Create a Home Valuation Report for This Property
The Home Valuation Report is an in-depth analysis detailing your home's value as well as a comparison with similar homes in the area
Home Values in the Area
Average Home Value in this Area
Purchase History
| Date | Buyer | Sale Price | Title Company |
|---|---|---|---|
| Blount Craig | -- | Chicago Title | |
| Blount Craig | $130,000 | Chicago Title | |
| Byars John | $104,500 | Commonwealth Land Title Co |
Source: Public Records
Mortgage History
| Date | Status | Borrower | Loan Amount |
|---|---|---|---|
| Previous Owner | Blount Craig | $128,089 | |
| Previous Owner | Byars John | $106,590 |
Source: Public Records
Tax History
| Year | Tax Paid | Tax Assessment Tax Assessment Total Assessment is a certain percentage of the fair market value that is determined by local assessors to be the total taxable value of land and additions on the property. | Land | Improvement |
|---|---|---|---|---|
| 2025 | $2,308 | $186,814 | $43,438 | $143,376 |
| 2024 | $2,224 | $183,152 | $42,587 | $140,565 |
| 2023 | $2,224 | $179,561 | $41,752 | $137,809 |
| 2022 | $2,200 | $176,041 | $40,934 | $135,107 |
| 2021 | $2,159 | $172,590 | $40,132 | $132,458 |
| 2020 | $2,159 | $170,821 | $39,721 | $131,100 |
| 2019 | $2,159 | $170,821 | $39,721 | $131,100 |
| 2018 | $2,084 | $164,190 | $38,180 | $126,010 |
| 2017 | $2,081 | $160,972 | $37,432 | $123,540 |
| 2016 | $2,026 | $157,817 | $36,699 | $121,118 |
| 2015 | $1,929 | $155,447 | $36,148 | $119,299 |
| 2014 | $1,909 | $152,403 | $35,440 | $116,963 |
Source: Public Records
Map
Nearby Homes
- 0 Orrick Avenue Lot 370 Unit 9993457
- 14 Cache Creek
- 13 Cache Creek
- 16701 Matterhorn Dr
- 16401 Jungfrau Way Lot 9
- 23601 Gotthard Place
- 0 270th St Unit NDP2408166
- 0 Wadford-Tehachapi Rd Unit 202405459
- 0 Maple Ave Lot #125 Unit 202406033
- 0 Parcel Map 32 Unit 202507373
- 0 Jacks Hill Road Lot 2 Unit 9993487
- 24 Cache Creek
- 15 Cache Creek
- 0 Red Fir Ct Unit SR23059797
- 0 Apn#415-130-77-00-6 Unit 202506162
- 0 Gamble Springs Rd Unit 25003483
- 1 270th St
- 24319 Hemlock Ave
- 0 Parcel 224 450 01 00 Unit SR26021486
- 0 0 Unit 202601218
- 19309 Moon Dr
- 19317 Moon Dr
- 19312 Moon Dr
- 19305 Moon Dr
- 19320 Moon Dr
- 19400 Brite Valley Rd
- 19304 Moon Dr
- 19324 Brite Valley Rd
- 19400 Moon Dr
- 19408 Brite Valley Rd
- 22511 Camp Dr
- 22501 Camp Dr
- 19404 Moon Dr
- 19312 Brite Valley Rd
- 22521 Camp Dr
- 19408 Moon Dr
- 22550 Camp Dr
- 22531 Camp Dr
- 22541 Camp Dr
- 19412 Moon Dr
Your Personal Tour Guide
Ask me questions while you tour the home.