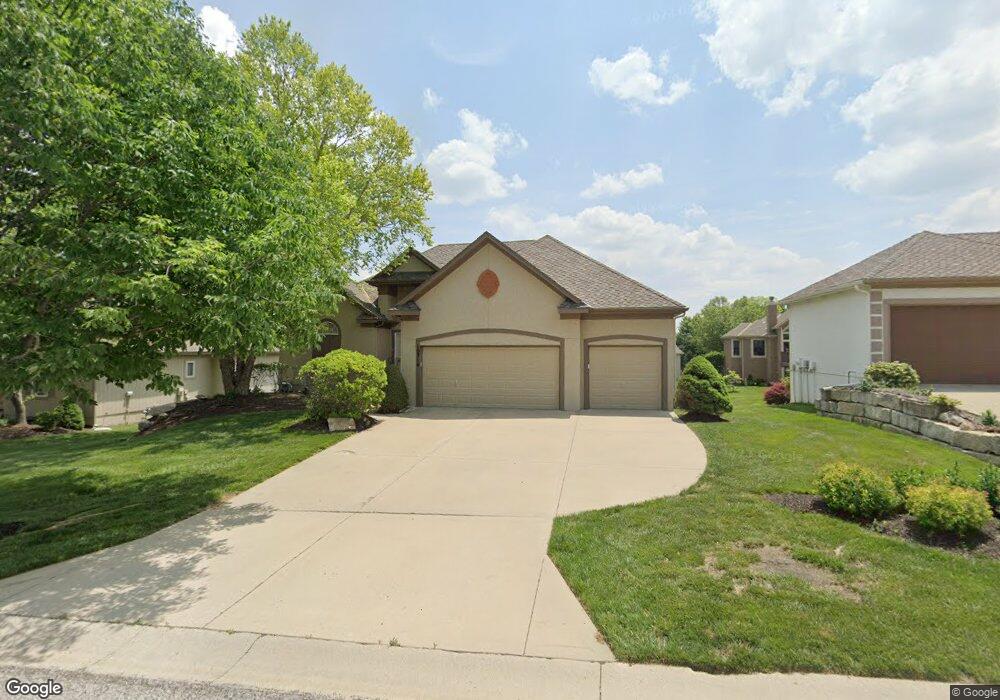
19314 W 98th St Lenexa, KS 66220
Estimated Value: $563,726 - $607,000
3
Beds
3
Baths
2,150
Sq Ft
$274/Sq Ft
Est. Value
About This Home
This home is located at 19314 W 98th St, Lenexa, KS 66220 and is currently estimated at $588,932, approximately $273 per square foot. 19314 W 98th St is a home located in Johnson County with nearby schools including Manchester Park Elementary School, Prairie Trail Middle School, and Olathe Northwest High School.
Ownership History
Date
Name
Owned For
Owner Type
Purchase Details
Closed on
May 29, 2013
Sold by
Courtney Susan J
Bought by
Courtney Susan J and The Susan Courtney Trust
Current Estimated Value
Home Financials for this Owner
Home Financials are based on the most recent Mortgage that was taken out on this home.
Original Mortgage
$271,800
Outstanding Balance
$58,231
Interest Rate
2.65%
Mortgage Type
New Conventional
Estimated Equity
$530,701
Purchase Details
Closed on
Apr 8, 2009
Sold by
Courtney Susan J
Bought by
Courtney Susan J
Purchase Details
Closed on
Apr 7, 2003
Sold by
Glen A Mock Construction & Design Inc
Bought by
Courtney Susan J
Home Financials for this Owner
Home Financials are based on the most recent Mortgage that was taken out on this home.
Original Mortgage
$316,000
Interest Rate
5.71%
Create a Home Valuation Report for This Property
The Home Valuation Report is an in-depth analysis detailing your home's value as well as a comparison with similar homes in the area
Home Values in the Area
Average Home Value in this Area
Purchase History
| Date | Buyer | Sale Price | Title Company |
|---|---|---|---|
| Courtney Susan J | -- | Alpha Title Llc | |
| Courtney Susan J | -- | Alpha Title Llc | |
| Courtney Susan J | -- | None Available | |
| Courtney Susan J | -- | Security Land Title Company |
Source: Public Records
Mortgage History
| Date | Status | Borrower | Loan Amount |
|---|---|---|---|
| Open | Courtney Susan J | $271,800 | |
| Closed | Courtney Susan J | $316,000 |
Source: Public Records
Tax History Compared to Growth
Tax History
| Year | Tax Paid | Tax Assessment Tax Assessment Total Assessment is a certain percentage of the fair market value that is determined by local assessors to be the total taxable value of land and additions on the property. | Land | Improvement |
|---|---|---|---|---|
| 2024 | $7,886 | $64,124 | $11,116 | $53,008 |
| 2023 | $8,158 | $65,182 | $11,116 | $54,066 |
| 2022 | $7,427 | $57,868 | $8,554 | $49,314 |
| 2021 | $7,125 | $52,854 | $8,554 | $44,300 |
| 2020 | $6,841 | $50,244 | $8,554 | $41,690 |
| 2019 | $6,830 | $49,795 | $7,445 | $42,350 |
| 2018 | $6,508 | $46,908 | $7,445 | $39,463 |
| 2017 | $6,773 | $47,794 | $7,445 | $40,349 |
| 2016 | $6,380 | $46,035 | $7,090 | $38,945 |
| 2015 | $6,377 | $46,035 | $7,090 | $38,945 |
| 2013 | -- | $42,412 | $7,090 | $35,322 |
Source: Public Records
Map
Nearby Homes
- 9835 Walker St
- 18932 W 100th St
- 18804 W 99th St
- 18732 W 99th St
- 9844 Stevenson St
- 18637 W 97th Terrace
- 0 W 95th St
- 9917 Fountain Cir
- 9517 Falcon Ridge Dr
- 20516 W 98th Place
- 9705 Sunset Cir
- 20308 W 92nd St
- 9553 Jupiter St
- 9593 Jupiter St
- 9551 Jupiter St
- 9567 Jupiter St
- 9595 Jupiter St
- 9579 Jupiter St
- 9537 Jupiter St
- 9581 Jupiter St
- 19310 W 98th St
- 19318 W 98th St
- 9742 Cooper St
- 9738 Cooper St
- 9746 Cooper St
- 9734 Cooper St
- 19330 W 98th St
- 19322 W 98th St
- 19313 W 98th St
- 19307 W 98th St
- 19319 W 98th St
- 19301 W 98th St
- 9741 Cooper St
- 9745 Cooper St
- 9737 Cooper St
- 19323 W 98th St
- 9749 Cooper St
- 19412 W 98th St
- 19406 W 98th St
- 8255 Aurora St