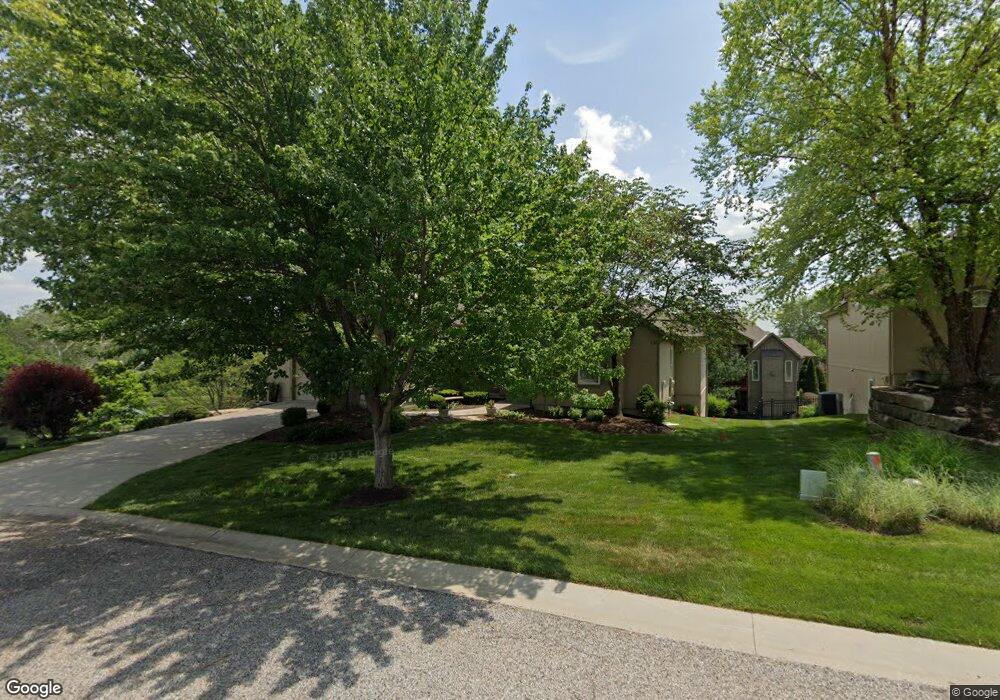
19318 W 98th St Lenexa, KS 66220
Estimated Value: $586,000 - $621,000
4
Beds
3
Baths
1,894
Sq Ft
$317/Sq Ft
Est. Value
About This Home
This home is located at 19318 W 98th St, Lenexa, KS 66220 and is currently estimated at $600,992, approximately $317 per square foot. 19318 W 98th St is a home located in Johnson County with nearby schools including Manchester Park Elementary School, Prairie Trail Middle School, and Olathe Northwest High School.
Ownership History
Date
Name
Owned For
Owner Type
Purchase Details
Closed on
Sep 28, 2021
Sold by
Hancock John L and Hancock Karen M
Bought by
Hancock John L and Hancock Karen M
Current Estimated Value
Purchase Details
Closed on
Jun 27, 2002
Sold by
Falcon Building Company Llc
Bought by
Eggers Leland D and Eggers Karen S
Home Financials for this Owner
Home Financials are based on the most recent Mortgage that was taken out on this home.
Original Mortgage
$294,500
Interest Rate
6.73%
Purchase Details
Closed on
Nov 29, 2001
Sold by
Rockwood Custom Homes Llc
Bought by
Hancock John L and Hancock Karen M
Home Financials for this Owner
Home Financials are based on the most recent Mortgage that was taken out on this home.
Original Mortgage
$216,500
Interest Rate
6.59%
Create a Home Valuation Report for This Property
The Home Valuation Report is an in-depth analysis detailing your home's value as well as a comparison with similar homes in the area
Home Values in the Area
Average Home Value in this Area
Purchase History
| Date | Buyer | Sale Price | Title Company |
|---|---|---|---|
| Hancock John L | -- | None Listed On Document | |
| Eggers Leland D | -- | Security Land Title Company | |
| Hancock John L | -- | Security Land Title Company |
Source: Public Records
Mortgage History
| Date | Status | Borrower | Loan Amount |
|---|---|---|---|
| Previous Owner | Eggers Leland D | $294,500 | |
| Previous Owner | Hancock John L | $216,500 |
Source: Public Records
Tax History Compared to Growth
Tax History
| Year | Tax Paid | Tax Assessment Tax Assessment Total Assessment is a certain percentage of the fair market value that is determined by local assessors to be the total taxable value of land and additions on the property. | Land | Improvement |
|---|---|---|---|---|
| 2024 | $7,718 | $62,767 | $12,636 | $50,131 |
| 2023 | $7,953 | $63,537 | $12,636 | $50,901 |
| 2022 | $7,135 | $55,591 | $9,721 | $45,870 |
| 2021 | $6,921 | $51,325 | $9,721 | $41,604 |
| 2020 | $6,650 | $48,829 | $9,721 | $39,108 |
| 2019 | $6,614 | $48,208 | $8,456 | $39,752 |
| 2018 | $6,304 | $45,425 | $8,456 | $36,969 |
| 2017 | $6,465 | $45,598 | $8,456 | $37,142 |
| 2016 | $5,910 | $42,608 | $8,048 | $34,560 |
| 2015 | $5,893 | $42,504 | $8,048 | $34,456 |
| 2013 | -- | $38,870 | $8,048 | $30,822 |
Source: Public Records
Map
Nearby Homes
- 9835 Walker St
- 18932 W 100th St
- 18804 W 99th St
- 18732 W 99th St
- 9844 Stevenson St
- 18637 W 97th Terrace
- 0 W 95th St
- 9917 Fountain Cir
- 9517 Falcon Ridge Dr
- 20516 W 98th Place
- 9705 Sunset Cir
- 20308 W 92nd St
- 9553 Jupiter St
- 9593 Jupiter St
- 9551 Jupiter St
- 9567 Jupiter St
- 9595 Jupiter St
- 9579 Jupiter St
- 9537 Jupiter St
- 9581 Jupiter St
- 19314 W 98th St
- 9734 Cooper St
- 9738 Cooper St
- 9742 Cooper St
- 19310 W 98th St
- 19322 W 98th St
- 9746 Cooper St
- 19330 W 98th St
- 9737 Cooper St
- 9741 Cooper St
- 9733 Cooper St
- 19418 W 98th St
- 19412 W 98th St
- 9745 Cooper St
- 19313 W 98th St
- 19307 W 98th St
- 19406 W 98th St
- 19319 W 98th St
- 9749 Cooper St
- 19301 W 98th St