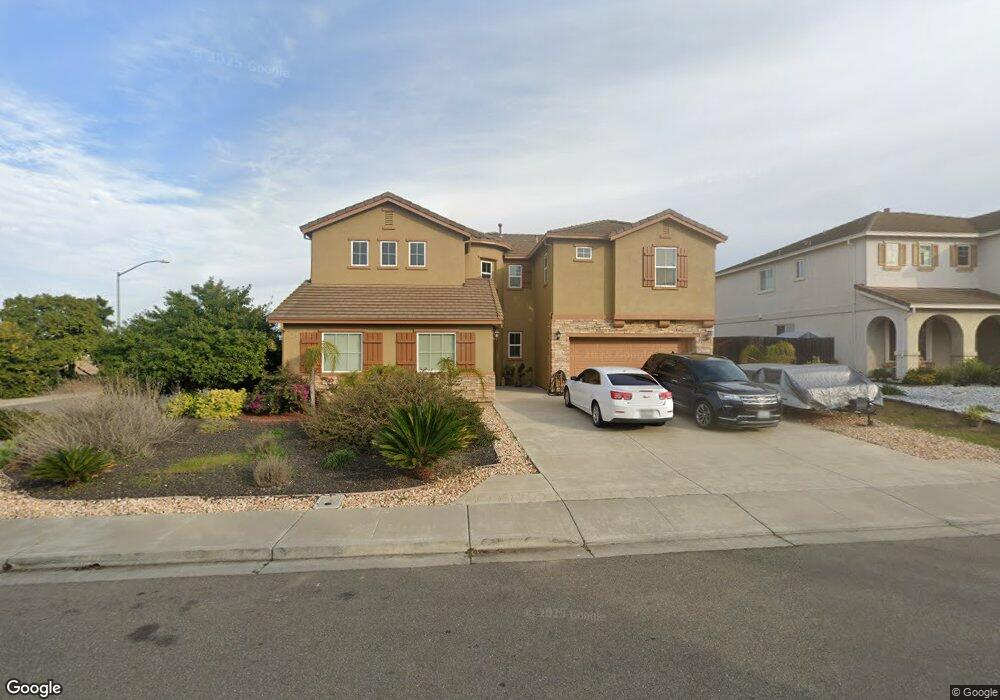
1932 Cinnamon Ridge Dr Oakley, CA 94561
South Oakley NeighborhoodEstimated Value: $838,620 - $1,010,000
4
Beds
4
Baths
3,683
Sq Ft
$253/Sq Ft
Est. Value
About This Home
This home is located at 1932 Cinnamon Ridge Dr, Oakley, CA 94561 and is currently estimated at $933,155, approximately $253 per square foot. 1932 Cinnamon Ridge Dr is a home located in Contra Costa County with nearby schools including Almond Grove Elementary School, O'Hara Park Middle School, and Freedom High School.
Ownership History
Date
Name
Owned For
Owner Type
Purchase Details
Closed on
Mar 14, 2011
Sold by
Village Solutions Foundation
Bought by
Detiege Beverly R
Current Estimated Value
Home Financials for this Owner
Home Financials are based on the most recent Mortgage that was taken out on this home.
Original Mortgage
$330,406
Outstanding Balance
$226,808
Interest Rate
4.77%
Mortgage Type
FHA
Estimated Equity
$706,347
Purchase Details
Closed on
Nov 19, 2010
Sold by
Chase Home Finance
Bought by
Village Solutions Foundation
Purchase Details
Closed on
Aug 15, 2010
Sold by
Brinkman Mark and Brinkman Roberta
Bought by
Chase Home Finance Llc
Purchase Details
Closed on
Jan 29, 2007
Sold by
Discovery Builders Inc
Bought by
Brinkman Mark and Brinkman Roberta
Home Financials for this Owner
Home Financials are based on the most recent Mortgage that was taken out on this home.
Original Mortgage
$610,150
Interest Rate
5%
Mortgage Type
Purchase Money Mortgage
Create a Home Valuation Report for This Property
The Home Valuation Report is an in-depth analysis detailing your home's value as well as a comparison with similar homes in the area
Home Values in the Area
Average Home Value in this Area
Purchase History
| Date | Buyer | Sale Price | Title Company |
|---|---|---|---|
| Detiege Beverly R | $339,000 | First American Title Company | |
| Village Solutions Foundation | $339,500 | Chicago Title Company | |
| Chase Home Finance Llc | $299,230 | Accommodation | |
| Brinkman Mark | $763,000 | Old Republic Title Company |
Source: Public Records
Mortgage History
| Date | Status | Borrower | Loan Amount |
|---|---|---|---|
| Open | Detiege Beverly R | $330,406 | |
| Previous Owner | Brinkman Mark | $610,150 |
Source: Public Records
Tax History
| Year | Tax Paid | Tax Assessment Tax Assessment Total Assessment is a certain percentage of the fair market value that is determined by local assessors to be the total taxable value of land and additions on the property. | Land | Improvement |
|---|---|---|---|---|
| 2025 | $8,082 | $434,302 | $44,833 | $389,469 |
| 2024 | $7,800 | $425,787 | $43,954 | $381,833 |
| 2023 | $7,800 | $417,440 | $43,093 | $374,347 |
| 2022 | $7,652 | $409,256 | $42,249 | $367,007 |
| 2021 | $7,457 | $401,232 | $41,421 | $359,811 |
| 2019 | $7,094 | $389,334 | $40,194 | $349,140 |
| 2018 | $6,885 | $381,701 | $39,406 | $342,295 |
| 2017 | $6,778 | $374,218 | $38,634 | $335,584 |
| 2016 | $6,445 | $366,881 | $37,877 | $329,004 |
| 2015 | $6,425 | $361,372 | $37,309 | $324,063 |
| 2014 | $6,342 | $354,295 | $36,579 | $317,716 |
Source: Public Records
Map
Nearby Homes
- 130 Ridge Crest Ct
- 23 Cloverbrook Ct
- 3690 Cloverbrook Ave
- 259 Eagle Nest Dr
- 361 Clove Way
- 43 Sorrel Ct
- 353 Barn Dance Way
- 876 Diamante Way
- 3901-B Rose Ave
- 25 Solitude Ct
- 806 Atherton Blvd
- 2986 Atherton Place
- 1148 Breton Dr
- 75 E Bolton Rd Unit 29
- 46 Sugarbush Ct
- 0 Almond Dr Unit 41106452
- 2812 Pristine Way
- 49 Nettle Ct
- 433 Ramos Ranch Rd
- 1083 Steeple Blvd
- 1928 Cinnamon Ridge Dr
- 2000 Cinnamon Ridge Dr
- 1924 Cinnamon Ridge Dr
- 2001 Cinnamon Ridge Dr
- 2004 Cinnamon Ridge Dr
- 1920 Cinnamon Ridge Dr
- 160 Ridge Crest Ct
- 2005 Cinnamon Ridge Dr
- 2008 Cinnamon Ridge Dr
- 1916 Cinnamon Ridge Dr
- 170 Ridge Crest Ct
- 101 Mira Vista Dr
- 100 Mira Vista Dr
- 105 Mira Vista Dr
- 120 Ridge Crest Ct
- 104 Mira Vista Dr
- 1912 Cinnamon Ridge Dr
- 110 Ridge Crest Ct
- 108 Mira Vista Dr
- 10 Ridge Crest Ct
Your Personal Tour Guide
Ask me questions while you tour the home.