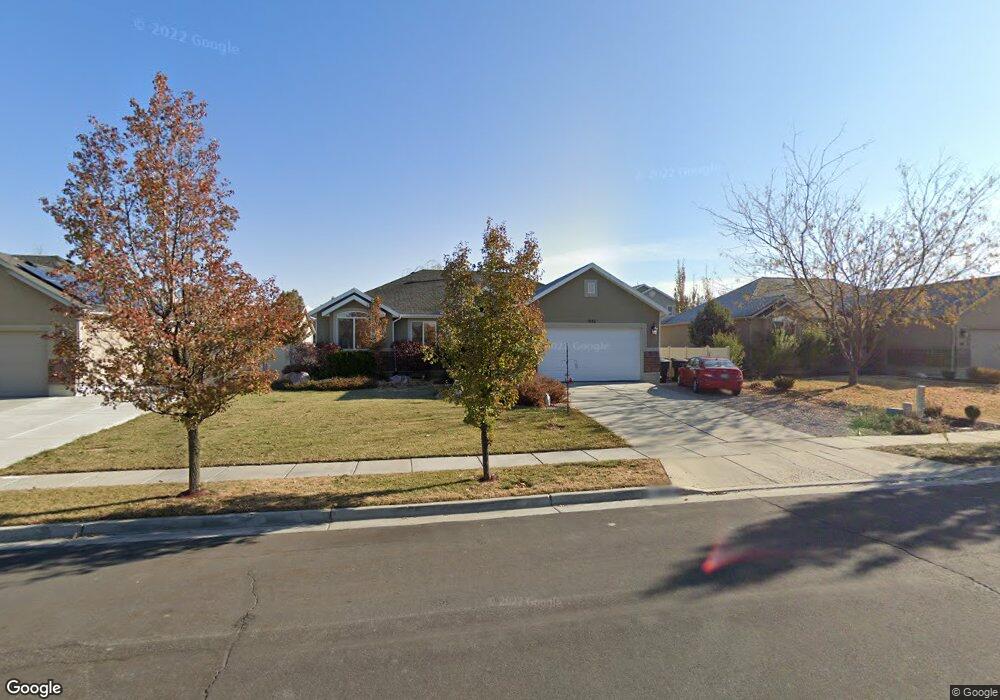
1932 N 2700 W Clearfield, UT 84015
Estimated Value: $543,699 - $592,000
5
Beds
3
Baths
3,030
Sq Ft
$187/Sq Ft
Est. Value
About This Home
This home is located at 1932 N 2700 W, Clearfield, UT 84015 and is currently estimated at $565,425, approximately $186 per square foot. 1932 N 2700 W is a home located in Davis County with nearby schools including West Clinton Elementary School, West Point Junior High School, and Clearfield High School.
Ownership History
Date
Name
Owned For
Owner Type
Purchase Details
Closed on
Jul 26, 2017
Sold by
Laughter Shad D and Laughter Nicole M
Bought by
Gillies Daniel S and Gillies Heidi
Current Estimated Value
Home Financials for this Owner
Home Financials are based on the most recent Mortgage that was taken out on this home.
Original Mortgage
$264,349
Outstanding Balance
$219,750
Interest Rate
3.91%
Mortgage Type
New Conventional
Estimated Equity
$345,675
Purchase Details
Closed on
Nov 15, 2010
Sold by
Laughter Shad and Laughter Nicole M
Bought by
Laughter Shad D and Laughter Nicole M
Home Financials for this Owner
Home Financials are based on the most recent Mortgage that was taken out on this home.
Original Mortgage
$230,027
Interest Rate
4.25%
Mortgage Type
FHA
Purchase Details
Closed on
Oct 11, 2006
Sold by
Destination Homes Inc
Bought by
Laughter Shad and Laughter Nicole M
Home Financials for this Owner
Home Financials are based on the most recent Mortgage that was taken out on this home.
Original Mortgage
$45,429
Interest Rate
6.39%
Mortgage Type
Unknown
Purchase Details
Closed on
May 16, 2005
Sold by
M & D Developers Llc
Bought by
Destination Homes Inc
Home Financials for this Owner
Home Financials are based on the most recent Mortgage that was taken out on this home.
Original Mortgage
$182,438
Interest Rate
5.87%
Mortgage Type
Purchase Money Mortgage
Purchase Details
Closed on
May 5, 2005
Sold by
Hamblin Doug
Bought by
M & D Developers Llc
Home Financials for this Owner
Home Financials are based on the most recent Mortgage that was taken out on this home.
Original Mortgage
$182,438
Interest Rate
5.87%
Mortgage Type
Purchase Money Mortgage
Purchase Details
Closed on
Apr 12, 2005
Sold by
M & D Developers Llc
Bought by
Destinnation Homes Inc
Home Financials for this Owner
Home Financials are based on the most recent Mortgage that was taken out on this home.
Original Mortgage
$182,438
Interest Rate
5.87%
Mortgage Type
Purchase Money Mortgage
Purchase Details
Closed on
Feb 10, 2005
Sold by
Hamblin Investments Inc
Bought by
Hamblin Doug
Home Financials for this Owner
Home Financials are based on the most recent Mortgage that was taken out on this home.
Original Mortgage
$100,000
Interest Rate
5.81%
Mortgage Type
Purchase Money Mortgage
Create a Home Valuation Report for This Property
The Home Valuation Report is an in-depth analysis detailing your home's value as well as a comparison with similar homes in the area
Home Values in the Area
Average Home Value in this Area
Purchase History
| Date | Buyer | Sale Price | Title Company |
|---|---|---|---|
| Gillies Daniel S | -- | Title Guarantee | |
| Laughter Shad D | -- | Utah Commercial Title Co | |
| Laughter Shad | -- | Bonneville Superior Title Co | |
| Destination Homes Inc | -- | Heritage West Title Ins Agen | |
| M & D Developers Llc | -- | Heritage West Title Ins Agen | |
| Destinnation Homes Inc | -- | Heritage West Title Ins Agen | |
| Hamblin Doug | -- | Heritage West Title Ins Agen |
Source: Public Records
Mortgage History
| Date | Status | Borrower | Loan Amount |
|---|---|---|---|
| Open | Gillies Daniel S | $264,349 | |
| Previous Owner | Laughter Shad D | $230,027 | |
| Previous Owner | Laughter Shad | $45,429 | |
| Previous Owner | Laughter Shad | $181,716 | |
| Previous Owner | Destination Homes Inc | $182,438 | |
| Previous Owner | Hamblin Doug | $100,000 |
Source: Public Records
Tax History Compared to Growth
Tax History
| Year | Tax Paid | Tax Assessment Tax Assessment Total Assessment is a certain percentage of the fair market value that is determined by local assessors to be the total taxable value of land and additions on the property. | Land | Improvement |
|---|---|---|---|---|
| 2025 | $3,009 | $289,300 | $85,155 | $204,145 |
| 2024 | $2,885 | $278,850 | $94,124 | $184,726 |
| 2023 | $2,740 | $490,000 | $106,177 | $383,823 |
| 2022 | $2,935 | $290,401 | $66,072 | $224,329 |
| 2021 | $2,678 | $393,000 | $80,820 | $312,180 |
| 2020 | $2,334 | $339,000 | $67,689 | $271,311 |
| 2019 | $2,311 | $328,000 | $80,934 | $247,066 |
| 2018 | $2,166 | $302,000 | $68,602 | $233,398 |
| 2016 | $1,835 | $132,110 | $25,587 | $106,523 |
| 2015 | $1,918 | $131,285 | $25,587 | $105,698 |
| 2014 | $1,840 | $127,927 | $25,587 | $102,340 |
| 2013 | -- | $119,250 | $24,320 | $94,930 |
Source: Public Records
Map
Nearby Homes
- 2617 N 2080 W Unit 176
- 1648 N 2615 W
- Harvard Plan at Summerfield - Enclave
- 2208 W 2615 N
- Linden Plan at Summerfield - Vista
- Yale Plan at Summerfield - Enclave
- Gambel Oak Plan at Summerfield - Vista
- Cedar Plan at Summerfield - Vista
- Elm Plan at Summerfield - Vista
- Princeton Plan at Summerfield - Enclave
- Cambridge Plan at Summerfield - Enclave
- Cornell Plan at Summerfield - Enclave
- Sycamore Plan at Summerfield - Vista
- Berkeley Plan at Summerfield - Enclave
- Birch Plan at Summerfield - Vista
- Stanford Plan at Summerfield - Enclave
- 2219 N 2475 W
- 3941 W 1800 N
- 2434 W 2250 N
- 2322 N 2500 W