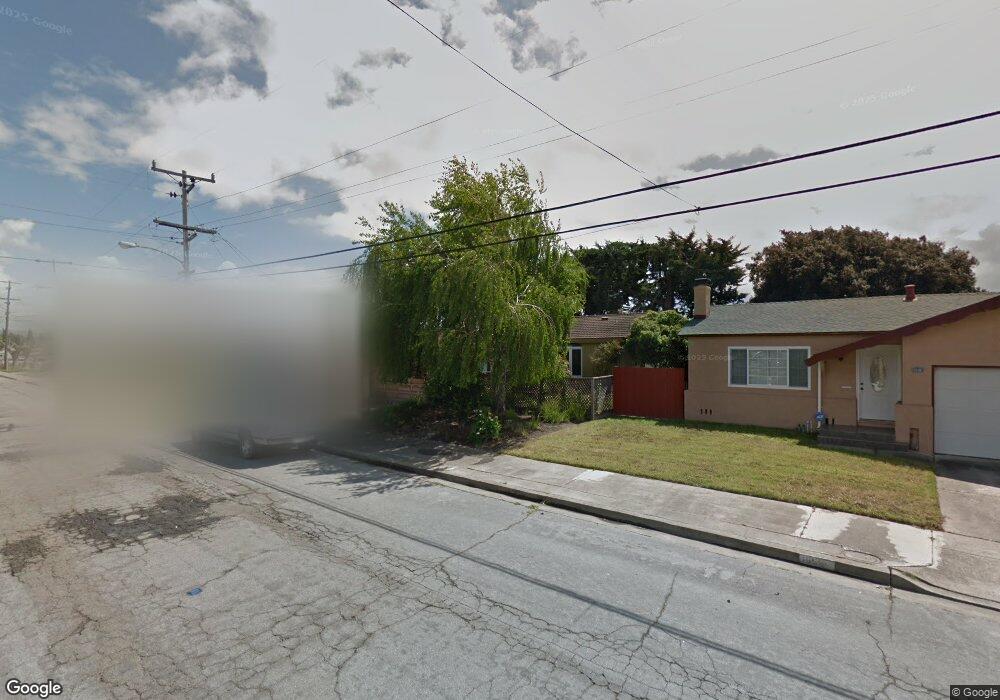
1932 Vining Dr San Leandro, CA 94579
Washington Manor-Bonaire NeighborhoodEstimated Value: $759,000 - $862,000
3
Beds
2
Baths
1,100
Sq Ft
$746/Sq Ft
Est. Value
About This Home
This home is located at 1932 Vining Dr, San Leandro, CA 94579 and is currently estimated at $820,816, approximately $746 per square foot. 1932 Vining Dr is a home located in Alameda County with nearby schools including Bay Elementary School, Washington Manor Middle School, and Arroyo High School.
Ownership History
Date
Name
Owned For
Owner Type
Purchase Details
Closed on
Aug 16, 2010
Sold by
Yother Cecil and Yother Agi
Bought by
Yother Cecil L and Yother Agi
Current Estimated Value
Purchase Details
Closed on
Jul 6, 2007
Sold by
Yother Cecil and Yother Frances Elaine
Bought by
Yother Cecil and Yother Agi
Home Financials for this Owner
Home Financials are based on the most recent Mortgage that was taken out on this home.
Original Mortgage
$350,000
Outstanding Balance
$218,876
Interest Rate
6.51%
Mortgage Type
Seller Take Back
Estimated Equity
$601,940
Purchase Details
Closed on
Dec 23, 1998
Sold by
Yother Cecil and Yother Frances E
Bought by
Yother Cecil and Yother Frances Elaine
Home Financials for this Owner
Home Financials are based on the most recent Mortgage that was taken out on this home.
Original Mortgage
$150,000
Interest Rate
6.82%
Purchase Details
Closed on
Sep 19, 1994
Sold by
Yother Cecil and Yother Cecil L
Bought by
Yother Cecil and Yother Frances Elaine
Create a Home Valuation Report for This Property
The Home Valuation Report is an in-depth analysis detailing your home's value as well as a comparison with similar homes in the area
Home Values in the Area
Average Home Value in this Area
Purchase History
| Date | Buyer | Sale Price | Title Company |
|---|---|---|---|
| Yother Cecil L | -- | None Available | |
| Yother Cecil | $485,000 | Placer Title Company | |
| Yother Cecil | -- | -- | |
| Yother Cecil | -- | Old Republic Title Company | |
| Yother Cecil | -- | -- |
Source: Public Records
Mortgage History
| Date | Status | Borrower | Loan Amount |
|---|---|---|---|
| Open | Yother Cecil | $350,000 | |
| Previous Owner | Yother Cecil | $150,000 |
Source: Public Records
Tax History
| Year | Tax Paid | Tax Assessment Tax Assessment Total Assessment is a certain percentage of the fair market value that is determined by local assessors to be the total taxable value of land and additions on the property. | Land | Improvement |
|---|---|---|---|---|
| 2025 | $1,726 | $83,850 | $39,473 | $44,377 |
| 2024 | $1,726 | $82,206 | $38,699 | $43,507 |
| 2023 | $1,739 | $80,595 | $37,941 | $42,654 |
| 2022 | $1,694 | $79,015 | $37,197 | $41,818 |
| 2021 | $1,637 | $77,465 | $36,467 | $40,998 |
| 2020 | $1,585 | $76,671 | $36,094 | $40,577 |
| 2019 | $1,568 | $75,168 | $35,386 | $39,782 |
| 2018 | $1,411 | $73,694 | $34,692 | $39,002 |
| 2017 | $1,351 | $72,249 | $34,012 | $38,237 |
| 2016 | $1,305 | $70,832 | $33,345 | $37,487 |
| 2015 | $1,273 | $69,768 | $32,844 | $36,924 |
| 2014 | $1,254 | $68,402 | $32,201 | $36,201 |
Source: Public Records
Map
Nearby Homes
- 15744 Via Sonata
- 1540 Sayre St
- 15512 Farnsworth St
- 15766 Via Sorrento
- 2100 Lewelling Blvd Unit 60
- 191 Santa Teresa
- 286 Santa Susana
- 157 Santa Teresa
- 1078 Via Enrico
- 2213 Wigeon Ct
- 16132 Via Catherine
- 1391 Via Faisan
- 15274 Laverne Dr
- 16175 Via Walter
- 15239 Laverne Ct
- 407 Santa Monica
- 872 Via Bregani
- 1343 Fargo Ave
- 15106 Edgemoor St
- 0 E 14th St Unit 41122018
- 1928 Vining Dr
- 1936 Vining Dr
- 1924 Vining Dr
- 1940 Vining Dr
- 15683 Montreal St
- 1927 Vining Dr
- 1944 Vining Dr
- 1920 Vining Dr
- 15680 Montreal St
- 1950 Vining Dr
- 15675 Montreal St
- 1904 Vining Dr
- 15684 Calgary St
- 15691 Hebron Ct
- 15668 Montreal St
- 15678 Calgary St
- 15659 Montreal St
- 15683 Hebron Ct
- 1888 Vining Dr
- 15654 Montreal St
Your Personal Tour Guide
Ask me questions while you tour the home.