19327 Smith Rd Redding, CA 96002
Estimated Value: $270,000 - $397,000
3
Beds
2
Baths
1,810
Sq Ft
$191/Sq Ft
Est. Value
About This Home
This home is located at 19327 Smith Rd, Redding, CA 96002 and is currently estimated at $345,973, approximately $191 per square foot. 19327 Smith Rd is a home located in Shasta County with nearby schools including Prairie Elementary School, Pacheco Elementary School, and Redding Collegiate Academy.
Ownership History
Date
Name
Owned For
Owner Type
Purchase Details
Closed on
Feb 10, 2005
Sold by
Raab Randall E and Raab Rebecca A
Bought by
Raab Randall E and Raab Rebecca A
Current Estimated Value
Purchase Details
Closed on
Apr 30, 2002
Sold by
Hillan Darren D A and Hillan Caroline S
Bought by
Raab Randall E and Raab Rebecca A
Home Financials for this Owner
Home Financials are based on the most recent Mortgage that was taken out on this home.
Original Mortgage
$76,000
Outstanding Balance
$32,543
Interest Rate
7.13%
Estimated Equity
$313,430
Purchase Details
Closed on
Sep 24, 1998
Sold by
Hillan Darren D A
Bought by
Hillan Darren D A and Hillan Caroline S
Home Financials for this Owner
Home Financials are based on the most recent Mortgage that was taken out on this home.
Original Mortgage
$81,724
Interest Rate
6.88%
Mortgage Type
VA
Create a Home Valuation Report for This Property
The Home Valuation Report is an in-depth analysis detailing your home's value as well as a comparison with similar homes in the area
Purchase History
| Date | Buyer | Sale Price | Title Company |
|---|---|---|---|
| Raab Randall E | -- | -- | |
| Raab Randall E | $95,000 | Fidelity National Title Co | |
| Hillan Darren D A | -- | Fidelity National Title Co |
Source: Public Records
Mortgage History
| Date | Status | Borrower | Loan Amount |
|---|---|---|---|
| Open | Raab Randall E | $76,000 | |
| Previous Owner | Hillan Darren D A | $81,724 |
Source: Public Records
Tax History
| Year | Tax Paid | Tax Assessment Tax Assessment Total Assessment is a certain percentage of the fair market value that is determined by local assessors to be the total taxable value of land and additions on the property. | Land | Improvement |
|---|---|---|---|---|
| 2025 | $1,502 | $140,317 | $59,078 | $81,239 |
| 2024 | $1,472 | $137,567 | $57,920 | $79,647 |
| 2023 | $1,472 | $134,871 | $56,785 | $78,086 |
| 2022 | $1,435 | $132,227 | $55,672 | $76,555 |
| 2021 | $1,412 | $129,635 | $54,581 | $75,054 |
| 2020 | $1,395 | $128,307 | $54,022 | $74,285 |
| 2019 | $1,377 | $125,792 | $52,963 | $72,829 |
| 2018 | $1,323 | $123,326 | $51,925 | $71,401 |
| 2017 | $1,342 | $120,908 | $50,907 | $70,001 |
| 2016 | $1,269 | $118,538 | $49,909 | $68,629 |
| 2015 | $1,268 | $116,759 | $49,160 | $67,599 |
| 2014 | $1,253 | $114,473 | $48,198 | $66,275 |
Source: Public Records
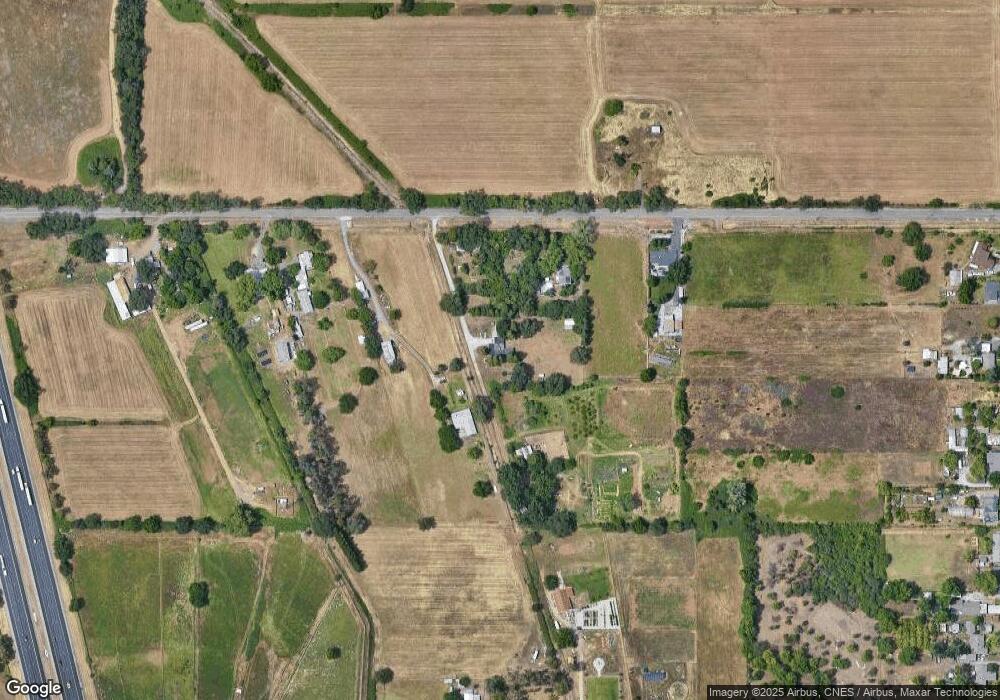
Map
Nearby Homes
- 19577 Medo Vale Ln
- 19233 W Niles Ln
- 7605 Churn Creek Rd
- 5521 Churn Creek Rd
- 0 Villa Ct
- 5551 Ebon
- 5717 Churn Creek Rd
- 2575 Uphill Ave
- 2561 Uphill Ave
- 7035 Riverside Dr
- 2000 Spur Ct
- 2478 Uphill Ave
- 6958 Riverside Dr
- 2532 Crimson Ct
- 5377 Turwar St
- 5355 Turwar St
- 5283 Turwar St
- 6681 Riverside Dr
- 2429 Seiad St
- 5118 Merced St
- 19401 Smith Rd
- 19397 Smith Rd
- 19378 Smith Rd
- 8122 Green Acres Ln Unit 1
- 8122 Green Acres Ln
- 19356 E Niles Ln
- 8143 Green Acres Ln
- 7952 Churn Creek Rd
- 19326 E Niles Ln
- 7918 Churn Creek Rd
- 8160 Green Acres Ln
- 7906 Churn Creek Rd
- 19388 E Niles Ln
- 7890 Churn Creek Rd
- 8177 Green Acres Ln
- 19441 E Niles Ln
- 5.03 Acres E Niles Ln
- 0 E Niles Ln
- 19308 E Niles Ln
- 7898 Churn Creek Rd
Your Personal Tour Guide
Ask me questions while you tour the home.