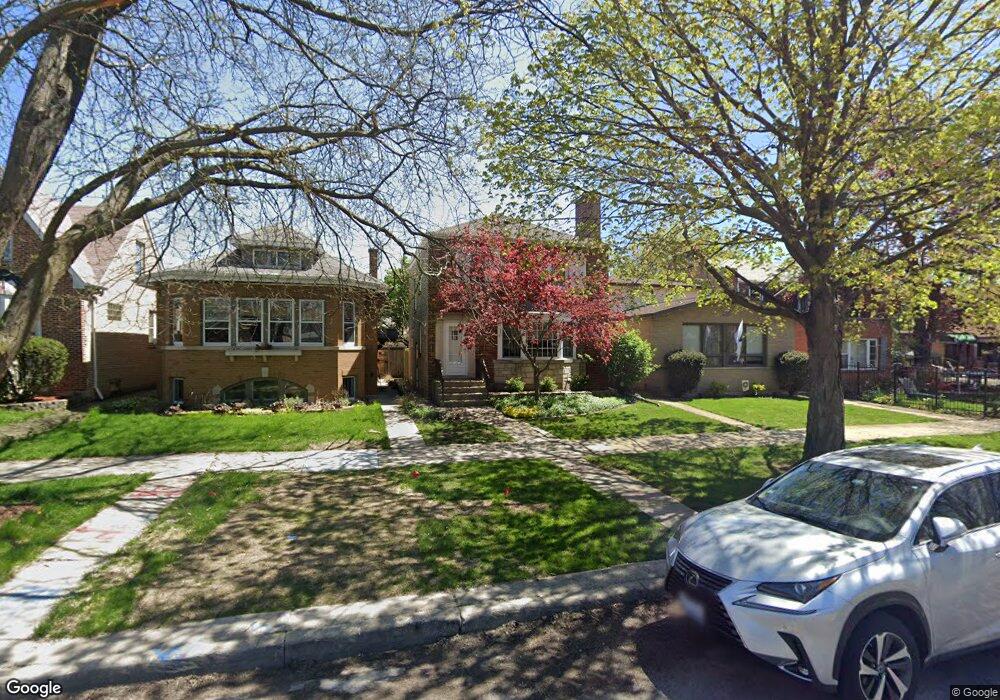
1933 N Newland Ave Chicago, IL 60707
Galewood NeighborhoodEstimated Value: $368,699 - $455,000
3
Beds
3
Baths
1,408
Sq Ft
$285/Sq Ft
Est. Value
About This Home
This home is located at 1933 N Newland Ave, Chicago, IL 60707 and is currently estimated at $401,675, approximately $285 per square foot. 1933 N Newland Ave is a home located in Cook County with nearby schools including Sayre Elementary Language Academy, Steinmetz College Prep, and Acero - Roberto Clemente Elementary School.
Ownership History
Date
Name
Owned For
Owner Type
Purchase Details
Closed on
Jun 29, 2018
Sold by
Barry John and Otto Daniel
Bought by
Barry John Keais and John Keais Barry Trust
Current Estimated Value
Purchase Details
Closed on
Dec 13, 2017
Sold by
Denny Mary Slgy
Bought by
Barry John and Otto Daniel
Home Financials for this Owner
Home Financials are based on the most recent Mortgage that was taken out on this home.
Original Mortgage
$246,450
Outstanding Balance
$206,461
Interest Rate
3.75%
Mortgage Type
New Conventional
Estimated Equity
$195,214
Purchase Details
Closed on
Nov 20, 2008
Sold by
Denny Steven A
Bought by
Denny Mary S
Purchase Details
Closed on
Feb 20, 1997
Sold by
Schemper Denny Steven A and Schemper Denny Mary
Bought by
Schemper Denny Steven A and Schemper Denny Mary
Create a Home Valuation Report for This Property
The Home Valuation Report is an in-depth analysis detailing your home's value as well as a comparison with similar homes in the area
Home Values in the Area
Average Home Value in this Area
Purchase History
| Date | Buyer | Sale Price | Title Company |
|---|---|---|---|
| Barry John Keais | -- | Attorney | |
| Barry John | $329,000 | Chicago Title | |
| Denny Mary S | -- | None Available | |
| Schemper Denny Steven A | -- | -- |
Source: Public Records
Mortgage History
| Date | Status | Borrower | Loan Amount |
|---|---|---|---|
| Open | Barry John | $246,450 |
Source: Public Records
Tax History Compared to Growth
Tax History
| Year | Tax Paid | Tax Assessment Tax Assessment Total Assessment is a certain percentage of the fair market value that is determined by local assessors to be the total taxable value of land and additions on the property. | Land | Improvement |
|---|---|---|---|---|
| 2024 | $3,850 | $29,380 | $11,625 | $17,755 |
| 2023 | $3,732 | $21,554 | $9,375 | $12,179 |
| 2022 | $3,732 | $21,554 | $9,375 | $12,179 |
| 2021 | $3,667 | $21,554 | $9,375 | $12,179 |
| 2020 | $4,386 | $22,780 | $4,687 | $18,093 |
| 2019 | $4,456 | $25,596 | $4,687 | $20,909 |
| 2018 | $5,059 | $25,596 | $4,687 | $20,909 |
| 2017 | $3,949 | $21,709 | $4,125 | $17,584 |
| 2016 | $3,850 | $21,709 | $4,125 | $17,584 |
| 2015 | $3,499 | $21,709 | $4,125 | $17,584 |
| 2014 | $3,626 | $22,098 | $3,750 | $18,348 |
| 2013 | $3,543 | $22,098 | $3,750 | $18,348 |
Source: Public Records
Map
Nearby Homes
- 1941 N New England Ave
- 1905 N Nordica Ave
- 1916 N Rutherford Ave
- 1709 N Newland Ave
- 2048 N Oak Park Ave
- 1701 N Newland Ave
- 1733 N Oak Park Ave
- 1937 N Normandy Ave
- 2054 N Nordica Ave
- 1600 N New England Ave Unit 4
- 2218 N Newland Ave Unit 203
- 2037 N Harlem Ave Unit 3E
- 1930 N Harlem Ave Unit 306
- 1930 N Harlem Ave Unit 402
- 1700 N Natoma Ave
- 7182 W Dickens Ave Unit 2W
- 1639 N Normandy Ave
- 2016 N Harlem Ave Unit 7W
- 2224 N Nordica Ave
- 7036 W Belden Ave
- 1935 N Newland Ave
- 1929 N Newland Ave
- 1939 N Newland Ave
- 1923 N Newland Ave
- 1941 N Newland Ave
- 1921 N Newland Ave
- 1945 N Newland Ave
- 1932 N New England Ave
- 1934 N New England Ave
- 1928 N New England Ave
- 1917 N Newland Ave
- 1938 N New England Ave
- 1924 N New England Ave
- 1940 N New England Ave
- 1922 N New England Ave
- 1915 N Newland Ave
- 1944 N New England Ave
- 1918 N New England Ave
- 6921 W Armitage Ave
- 6917 W Armitage Ave