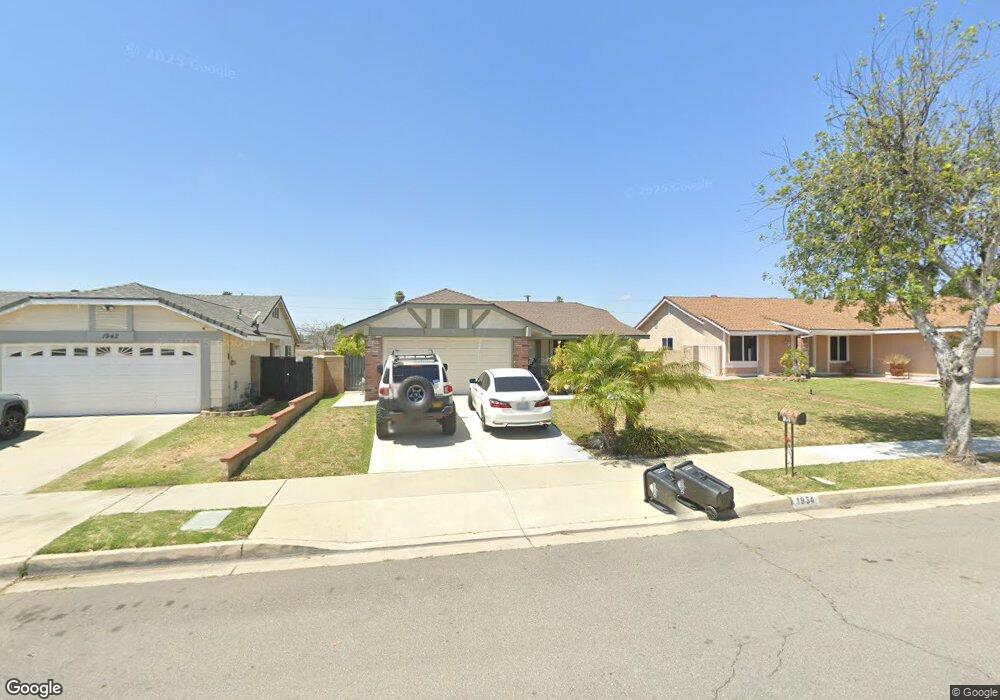
1934 S Oakland Ave Ontario, CA 91762
Downtown Ontario NeighborhoodEstimated Value: $659,599 - $763,000
3
Beds
2
Baths
1,260
Sq Ft
$568/Sq Ft
Est. Value
About This Home
This home is located at 1934 S Oakland Ave, Ontario, CA 91762 and is currently estimated at $715,400, approximately $567 per square foot. 1934 S Oakland Ave is a home located in San Bernardino County with nearby schools including Richard Haynes Elementary, Oaks Middle, and Ontario High School.
Ownership History
Date
Name
Owned For
Owner Type
Purchase Details
Closed on
Nov 29, 1999
Sold by
Lin Wen N
Bought by
Lin Wen Nan
Current Estimated Value
Home Financials for this Owner
Home Financials are based on the most recent Mortgage that was taken out on this home.
Original Mortgage
$108,000
Interest Rate
7.95%
Purchase Details
Closed on
Nov 20, 1999
Sold by
Lin Wen N
Bought by
Lin Wen Nan and The Wen Nan Lin Revocable Trus
Home Financials for this Owner
Home Financials are based on the most recent Mortgage that was taken out on this home.
Original Mortgage
$108,000
Interest Rate
7.95%
Purchase Details
Closed on
Oct 12, 1999
Sold by
Lin Wen N
Bought by
Lin Wen Nan and The Wen Nan Lin Revocable Trus
Home Financials for this Owner
Home Financials are based on the most recent Mortgage that was taken out on this home.
Original Mortgage
$108,000
Interest Rate
7.95%
Create a Home Valuation Report for This Property
The Home Valuation Report is an in-depth analysis detailing your home's value as well as a comparison with similar homes in the area
Home Values in the Area
Average Home Value in this Area
Purchase History
| Date | Buyer | Sale Price | Title Company |
|---|---|---|---|
| Lin Wen Nan | -- | Stewart Title Company | |
| Lin Wen Nan | -- | -- | |
| Lin Wen Nan | -- | -- |
Source: Public Records
Mortgage History
| Date | Status | Borrower | Loan Amount |
|---|---|---|---|
| Closed | Lin Wen Nan | $108,000 |
Source: Public Records
Tax History Compared to Growth
Tax History
| Year | Tax Paid | Tax Assessment Tax Assessment Total Assessment is a certain percentage of the fair market value that is determined by local assessors to be the total taxable value of land and additions on the property. | Land | Improvement |
|---|---|---|---|---|
| 2025 | $2,943 | $272,288 | $95,301 | $176,987 |
| 2024 | $2,943 | $266,949 | $93,432 | $173,517 |
| 2023 | $2,861 | $261,715 | $91,600 | $170,115 |
| 2022 | $2,823 | $256,583 | $89,804 | $166,779 |
| 2021 | $2,806 | $251,552 | $88,043 | $163,509 |
| 2020 | $2,757 | $248,972 | $87,140 | $161,832 |
| 2019 | $2,733 | $244,090 | $85,431 | $158,659 |
| 2018 | $2,696 | $239,304 | $83,756 | $155,548 |
| 2017 | $2,600 | $234,612 | $82,114 | $152,498 |
| 2016 | $2,498 | $230,012 | $80,504 | $149,508 |
| 2015 | $2,481 | $226,557 | $79,295 | $147,262 |
| 2014 | $2,405 | $222,119 | $77,742 | $144,377 |
Source: Public Records
Map
Nearby Homes
- 2022 S San Antonio Ave
- 1849 S San Antonio Ave
- 558 W Philadelphia St
- 1949 S Palm Place
- 926 W Philadelphia St Unit 49
- 926 W Philadelphia St Unit R99
- 926 W Philadelphia St Unit 10
- 1546 Redwood Ave
- 6736 Aster Ct
- 1620 S Cypress Ave
- 2333 S Via Esplanade Unit 29
- 2333 S Via Esplanade Unit 25
- 2350 S Via Esplanade Unit 31
- 4251 S Grasly Paseo
- 2343 S Via Veranda Unit 10
- 304 E Cedar St
- 310 E Philadelphia St Unit 35
- 310 E Philadelphia St
- 6763 Poinsettia Ct
- 6703 Poinsettia Ct
- 1926 S Oakland Ave
- 1942 S Oakland Ave
- 1950 S Oakland Ave
- 1918 S Oakland Ave
- 1929 S San Antonio Ave
- 1939 S San Antonio Ave
- 1925000 S San Antonio
- 1933 S Oakland Ave
- 1958 S Oakland Ave
- 1910 S Oakland Ave
- 1941 S Oakland Ave
- 1915 S San Antonio Ave
- 1925 S Oakland Ave
- 1949 S Oakland Ave
- 1943 S San Antonio Ave
- 1917 S Oakland Ave
- 1966 S Oakland Ave
- 1902 S Oakland Ave
- 1957 S Oakland Ave
- 1909 S Oakland Ave