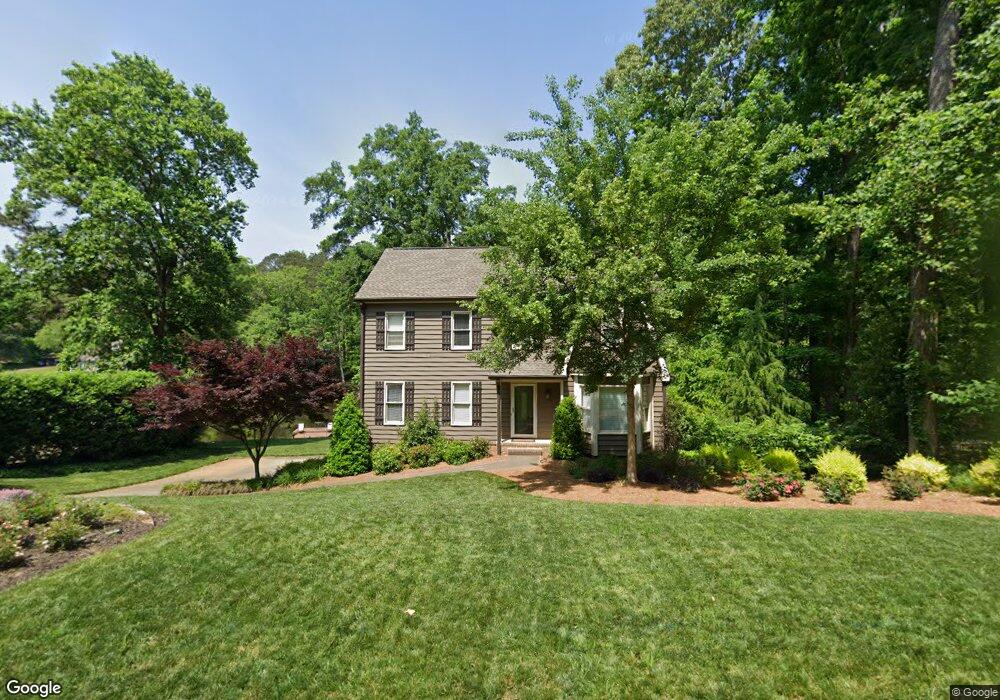
1935 Annwicks Dr Unit 2 Marietta, GA 30062
East Cobb NeighborhoodEstimated Value: $519,000 - $572,000
4
Beds
3
Baths
1,990
Sq Ft
$274/Sq Ft
Est. Value
About This Home
This home is located at 1935 Annwicks Dr Unit 2, Marietta, GA 30062 and is currently estimated at $546,130, approximately $274 per square foot. 1935 Annwicks Dr Unit 2 is a home located in Cobb County with nearby schools including Murdock Elementary School, Dodgen Middle School, and Pope High School.
Ownership History
Date
Name
Owned For
Owner Type
Purchase Details
Closed on
Aug 18, 2021
Sold by
Allen Alice N
Bought by
Guzman Mary Jane
Current Estimated Value
Purchase Details
Closed on
Oct 7, 2020
Sold by
Allen Harry D and Allen Alice N
Bought by
Allen Harry D and Allen Alice N
Purchase Details
Closed on
Jul 14, 2006
Sold by
Benedetto Roberto O and Benedetto Maria A
Bought by
Allen Haddy D
Home Financials for this Owner
Home Financials are based on the most recent Mortgage that was taken out on this home.
Original Mortgage
$184,000
Interest Rate
6.5%
Mortgage Type
New Conventional
Purchase Details
Closed on
Aug 12, 1999
Sold by
Critser Ronald R and Critser Earline V
Bought by
Benedetto Roberto O and Benedetto Maria A
Home Financials for this Owner
Home Financials are based on the most recent Mortgage that was taken out on this home.
Original Mortgage
$157,500
Interest Rate
7.65%
Mortgage Type
New Conventional
Create a Home Valuation Report for This Property
The Home Valuation Report is an in-depth analysis detailing your home's value as well as a comparison with similar homes in the area
Home Values in the Area
Average Home Value in this Area
Purchase History
| Date | Buyer | Sale Price | Title Company |
|---|---|---|---|
| Guzman Mary Jane | -- | None Available | |
| Allen Harry D | -- | None Available | |
| Allen Haddy D | $230,000 | -- | |
| Benedetto Roberto O | $175,000 | -- |
Source: Public Records
Mortgage History
| Date | Status | Borrower | Loan Amount |
|---|---|---|---|
| Previous Owner | Allen Haddy D | $184,000 | |
| Previous Owner | Benedetto Roberto O | $157,500 |
Source: Public Records
Tax History Compared to Growth
Tax History
| Year | Tax Paid | Tax Assessment Tax Assessment Total Assessment is a certain percentage of the fair market value that is determined by local assessors to be the total taxable value of land and additions on the property. | Land | Improvement |
|---|---|---|---|---|
| 2025 | $5,493 | $182,300 | $44,000 | $138,300 |
| 2024 | $5,496 | $182,300 | $44,000 | $138,300 |
| 2023 | $5,496 | $182,300 | $44,000 | $138,300 |
| 2022 | $4,788 | $157,772 | $44,000 | $113,772 |
| 2021 | $4,071 | $134,144 | $44,000 | $90,144 |
| 2020 | $4,071 | $134,144 | $44,000 | $90,144 |
| 2019 | $3,806 | $125,408 | $38,000 | $87,408 |
| 2018 | $3,745 | $123,396 | $30,000 | $93,396 |
| 2017 | $3,169 | $110,224 | $30,000 | $80,224 |
| 2016 | $3,169 | $110,224 | $30,000 | $80,224 |
| 2015 | $2,742 | $93,064 | $36,000 | $57,064 |
| 2014 | $2,765 | $93,064 | $0 | $0 |
Source: Public Records
Map
Nearby Homes
- 3292 Holly Mill Ct
- 3402 Devoe Ct
- 3025 Bunker Hill Cir
- 2041 Kramer Way
- 3218 Holly Mill Run
- 3246 Able Ct
- 1771 Canton Hills Cir
- 3495 Mill Bridge Dr Unit 2
- 3152 Normandy Cir NE
- 2988 Nestle Creek Dr
- 2197 Cedar Forks Dr Unit 1
- 2792 Craig Ct
- 2268 Woodsfield Ln NE
- 2726 Whitehurst Dr NE
- 3650 Oak Ln
- 2186 Cedar Forks Dr
- 1519 Brookcliff Cir
- 1945 Annwicks Dr
- 1936 Wicks Ridge Ln
- 1955 Annwicks Dr Unit 1
- 1926 Wicks Ridge Ln Unit 2
- 1920 Annwicks Dr
- 1930 Annwicks Dr
- 1916 Wicks Ridge Ln
- 1940 Wicks Ridge Ln
- 1940 Annwicks Dr
- 1965 Annwicks Dr Unit 1
- 1906 Wicks Ridge Ln
- 1890 Annwicks Dr
- 1950 Annwicks Dr
- 1905 Annwicks Dr Unit 2
- 0 Wicks Ridge Ln Unit 8585988
- 0 Wicks Ridge Ln Unit 8404604
- 0 Wicks Ridge Ln Unit 8024334
- 0 Wicks Ridge Ln
- 1942 Wicks Ridge Ln
- 1975 Annwicks Dr