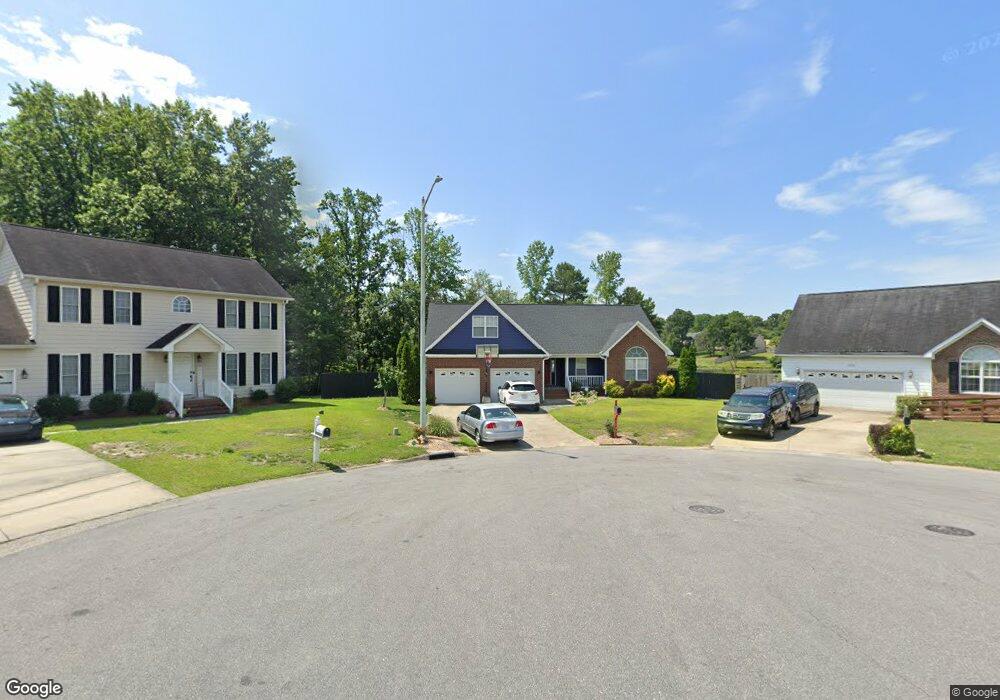
1935 Nuthatch Rd Fayetteville, NC 28304
Jack Britt NeighborhoodEstimated Value: $300,000 - $320,392
4
Beds
2
Baths
1,988
Sq Ft
$156/Sq Ft
Est. Value
About This Home
This home is located at 1935 Nuthatch Rd, Fayetteville, NC 28304 and is currently estimated at $310,348, approximately $156 per square foot. 1935 Nuthatch Rd is a home located in Cumberland County with nearby schools including E. Melvin Honeycutt Elementary School, John R. Griffin Middle School, and First Impressions Academy.
Ownership History
Date
Name
Owned For
Owner Type
Purchase Details
Closed on
Dec 17, 2020
Sold by
Ledesma Jose A and Ledesma Ivelisse
Bought by
Ledesma Jose A and Ledesma Ivelisse
Current Estimated Value
Home Financials for this Owner
Home Financials are based on the most recent Mortgage that was taken out on this home.
Original Mortgage
$181,740
Outstanding Balance
$162,091
Interest Rate
2.8%
Mortgage Type
VA
Estimated Equity
$148,257
Purchase Details
Closed on
Sep 2, 2011
Sold by
Stewart Christopher R and Auger Laurie Ann
Bought by
Ledesma Jose A and Mujiea Ivelisse
Home Financials for this Owner
Home Financials are based on the most recent Mortgage that was taken out on this home.
Original Mortgage
$211,961
Interest Rate
4.55%
Mortgage Type
New Conventional
Purchase Details
Closed on
Jul 14, 2008
Sold by
Armstrong Builders
Bought by
Auger Laurie
Home Financials for this Owner
Home Financials are based on the most recent Mortgage that was taken out on this home.
Original Mortgage
$210,939
Interest Rate
6.03%
Mortgage Type
VA
Create a Home Valuation Report for This Property
The Home Valuation Report is an in-depth analysis detailing your home's value as well as a comparison with similar homes in the area
Home Values in the Area
Average Home Value in this Area
Purchase History
| Date | Buyer | Sale Price | Title Company |
|---|---|---|---|
| Ledesma Jose A | -- | Vylla Title Llc | |
| Ledesma Jose A | $208,000 | -- | |
| Auger Laurie | $207,000 | -- |
Source: Public Records
Mortgage History
| Date | Status | Borrower | Loan Amount |
|---|---|---|---|
| Open | Ledesma Jose A | $181,740 | |
| Closed | Ledesma Jose A | $211,961 | |
| Previous Owner | Auger Laurie | $210,939 |
Source: Public Records
Tax History Compared to Growth
Tax History
| Year | Tax Paid | Tax Assessment Tax Assessment Total Assessment is a certain percentage of the fair market value that is determined by local assessors to be the total taxable value of land and additions on the property. | Land | Improvement |
|---|---|---|---|---|
| 2024 | $2,995 | $215,942 | $30,000 | $185,942 |
| 2023 | $2,481 | $215,942 | $30,000 | $185,942 |
| 2022 | $2,229 | $215,942 | $30,000 | $185,942 |
| 2021 | $2,229 | $215,942 | $30,000 | $185,942 |
| 2019 | $2,779 | $189,500 | $30,000 | $159,500 |
| 2018 | $2,779 | $189,500 | $30,000 | $159,500 |
| 2017 | $2,676 | $189,500 | $30,000 | $159,500 |
| 2016 | $2,671 | $204,400 | $30,000 | $174,400 |
| 2015 | $2,643 | $204,400 | $30,000 | $174,400 |
| 2014 | $2,636 | $204,400 | $30,000 | $174,400 |
Source: Public Records
Map
Nearby Homes
- 1932 Nuthatch Rd
- 1931 Nuthatch Rd
- 1929 Nuthatch Rd
- 1927 Nuthatch Rd
- 2803 Norcliff Dr
- 1902 Aldwych Place
- 1901 Aldwych Place
- 1925 Nuthatch Rd
- 2807 Norcliff Dr
- 1921 Nuthatch Rd
- 1905 Aldwych Place
- 1904 Aldwych Place
- 2806 Norcliff
- 1922 Nuthatch Rd
- 1984 Westcliff Rd
- 2811 Norcliff Dr
- 1917 Nuthatch Rd
- 1908 Aldwych Place
- 1918 Nuthatch Rd
- 2810 Norcliff Dr