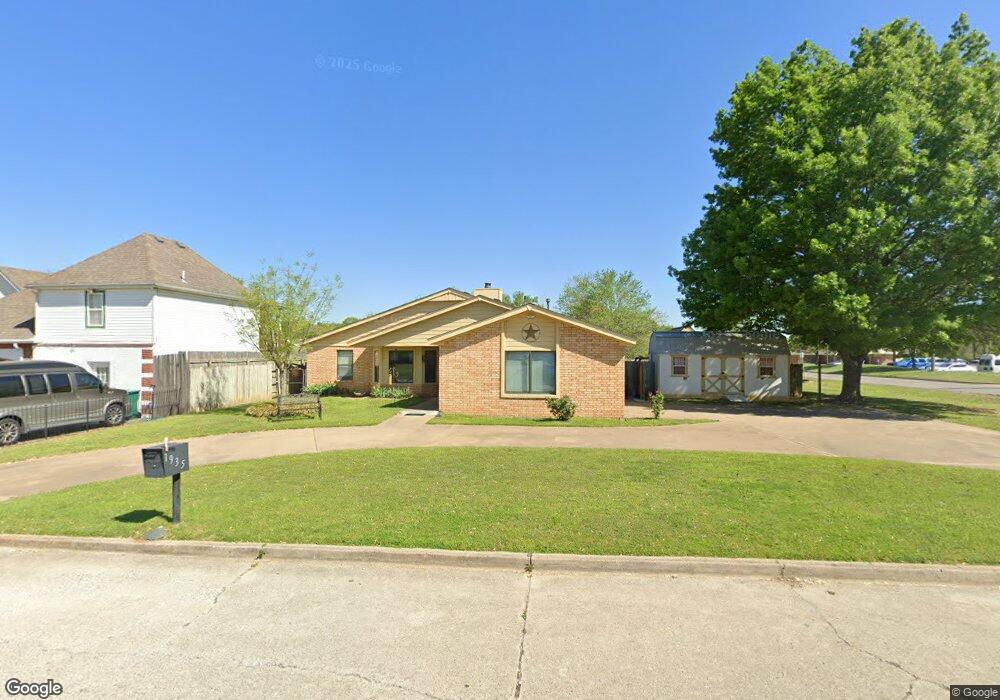
1935 Woodland Rd Sapulpa, OK 74066
Estimated Value: $217,368 - $277,000
3
Beds
2
Baths
1,570
Sq Ft
$156/Sq Ft
Est. Value
About This Home
This home is located at 1935 Woodland Rd, Sapulpa, OK 74066 and is currently estimated at $245,092, approximately $156 per square foot. 1935 Woodland Rd is a home located in Creek County with nearby schools including Sapulpa Middle School, Sapulpa Junior High School, and Sapulpa High School.
Ownership History
Date
Name
Owned For
Owner Type
Purchase Details
Closed on
Feb 15, 2017
Sold by
Fanning Mike and Fanning Karen
Bought by
Fannin Michael and Fannin Karen
Current Estimated Value
Home Financials for this Owner
Home Financials are based on the most recent Mortgage that was taken out on this home.
Original Mortgage
$72,500
Outstanding Balance
$54,946
Interest Rate
4.08%
Mortgage Type
New Conventional
Estimated Equity
$190,146
Purchase Details
Closed on
Dec 29, 2016
Sold by
Ljb Irrevocable Trust
Bought by
Fanning Mike and Fanning Karen
Home Financials for this Owner
Home Financials are based on the most recent Mortgage that was taken out on this home.
Original Mortgage
$72,500
Outstanding Balance
$54,946
Interest Rate
4.08%
Mortgage Type
New Conventional
Estimated Equity
$190,146
Purchase Details
Closed on
Jan 21, 2016
Sold by
Harris Larry L and Harris Margurte J
Bought by
Harris Larry L and Harris Margurite J
Create a Home Valuation Report for This Property
The Home Valuation Report is an in-depth analysis detailing your home's value as well as a comparison with similar homes in the area
Home Values in the Area
Average Home Value in this Area
Purchase History
| Date | Buyer | Sale Price | Title Company |
|---|---|---|---|
| Fannin Michael | -- | None Available | |
| Fanning Mike | $152,000 | Integrity Title & Closing Ll | |
| Harris Larry L | -- | None Available |
Source: Public Records
Mortgage History
| Date | Status | Borrower | Loan Amount |
|---|---|---|---|
| Open | Fanning Mike | $72,500 |
Source: Public Records
Tax History Compared to Growth
Tax History
| Year | Tax Paid | Tax Assessment Tax Assessment Total Assessment is a certain percentage of the fair market value that is determined by local assessors to be the total taxable value of land and additions on the property. | Land | Improvement |
|---|---|---|---|---|
| 2025 | $2,171 | $20,495 | $3,600 | $16,895 |
| 2024 | $2,171 | $18,855 | $3,600 | $15,255 |
| 2023 | $2,171 | $18,306 | $3,600 | $14,706 |
| 2022 | $1,927 | $17,773 | $3,600 | $14,173 |
| 2021 | $1,928 | $17,255 | $3,600 | $13,655 |
| 2020 | $1,992 | $17,883 | $3,600 | $14,283 |
| 2019 | $2,030 | $18,124 | $3,600 | $14,524 |
| 2018 | $2,072 | $18,124 | $3,600 | $14,524 |
| 2017 | $1,435 | $11,919 | $2,957 | $8,962 |
| 2016 | -- | $12,276 | $3,045 | $9,231 |
| 2015 | -- | $11,919 | $2,957 | $8,962 |
| 2014 | -- | $11,919 | $3,060 | $8,859 |
Source: Public Records
Map
Nearby Homes
- 1805 Glendale Rd
- 0 E Taft St
- 1608 Glendale Rd
- 1014 Ridge Rd
- 819 Ridge Rd
- 1440 Mabelle Dr
- 1210 Maybelle Dr
- 2810 E Hwy 117
- 1103 S Division St
- 0 Division St Unit 2535888
- 6 Mayfield St
- 813 E Teresa Ave
- 103 Woodview Ln
- 1033 E Thompson Ave
- 1010 E Thompson Ave
- 1023 E Thompson Ave
- 1140 E Hobson Ave
- 1001 E Thompson Ave
- 1008 E Lee Ave
- 420 Shadow Ln
- 1929 Woodland Rd
- 1940 Valley Rd
- 1934 Valley Rd
- 1923 Woodland Rd
- 1930 Woodland Rd
- 1928 Valley Rd
- 1924 Woodland Rd
- 1917 Woodland Rd
- 1205 Brenner Rd
- 1922 Valley Rd
- 1918 Woodland Rd
- 1937 Valley Rd
- 1911 Woodland Rd
- 1916 Valley Rd
- 1929 Valley Rd
- 1824 Woodland Rd
- 1923 Valley Rd
- 1934 Glendale Rd
- 1910 Valley Rd
- 1905 Woodland Rd