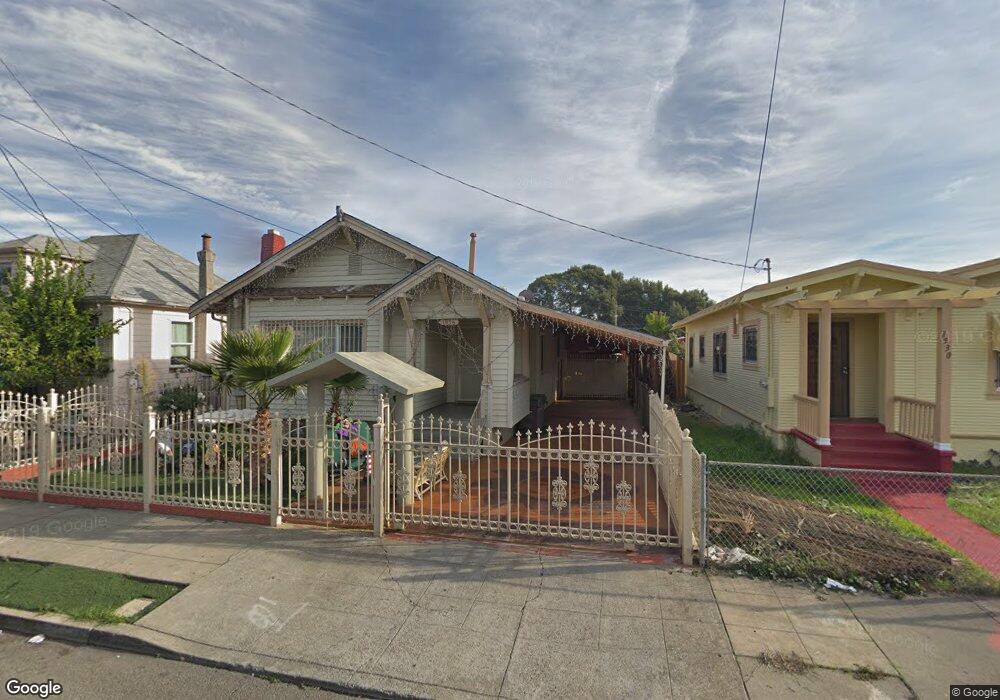
1936 69th Ave Oakland, CA 94621
Hegenberger NeighborhoodEstimated Value: $340,000 - $624,000
2
Beds
1
Bath
1,156
Sq Ft
$401/Sq Ft
Est. Value
About This Home
This home is located at 1936 69th Ave, Oakland, CA 94621 and is currently estimated at $463,909, approximately $401 per square foot. 1936 69th Ave is a home located in Alameda County with nearby schools including Markham Elementary School, Coliseum College Prep Academy, and Frick United Academy of Language.
Ownership History
Date
Name
Owned For
Owner Type
Purchase Details
Closed on
May 22, 2008
Sold by
Garcia Rodriguez Gerardo Zuno and Garcia De Zuno Hermelinda
Bought by
Garcia Rodriguez Gerardo Zuno and Garcia De Zuno Hermelinda
Current Estimated Value
Home Financials for this Owner
Home Financials are based on the most recent Mortgage that was taken out on this home.
Original Mortgage
$88,000
Interest Rate
5.87%
Mortgage Type
New Conventional
Create a Home Valuation Report for This Property
The Home Valuation Report is an in-depth analysis detailing your home's value as well as a comparison with similar homes in the area
Home Values in the Area
Average Home Value in this Area
Purchase History
| Date | Buyer | Sale Price | Title Company |
|---|---|---|---|
| Garcia Rodriguez Gerardo Zuno | -- | North American Title Company |
Source: Public Records
Mortgage History
| Date | Status | Borrower | Loan Amount |
|---|---|---|---|
| Closed | Garcia Rodriguez Gerardo Zuno | $88,000 |
Source: Public Records
Tax History
| Year | Tax Paid | Tax Assessment Tax Assessment Total Assessment is a certain percentage of the fair market value that is determined by local assessors to be the total taxable value of land and additions on the property. | Land | Improvement |
|---|---|---|---|---|
| 2025 | $4,143 | $185,668 | $55,700 | $129,968 |
| 2024 | $4,143 | $182,028 | $54,608 | $127,420 |
| 2023 | $4,246 | $178,460 | $53,538 | $124,922 |
| 2022 | $4,077 | $174,961 | $52,488 | $122,473 |
| 2021 | $3,773 | $171,530 | $51,459 | $120,071 |
| 2020 | $3,853 | $169,771 | $50,931 | $118,840 |
| 2019 | $3,511 | $166,443 | $49,933 | $116,510 |
| 2018 | $3,442 | $163,180 | $48,954 | $114,226 |
| 2017 | $3,282 | $159,980 | $47,994 | $111,986 |
| 2016 | $3,099 | $156,844 | $47,053 | $109,791 |
| 2015 | $3,079 | $154,488 | $46,346 | $108,142 |
| 2014 | $3,023 | $151,463 | $45,439 | $106,024 |
Source: Public Records
Map
Nearby Homes
Your Personal Tour Guide
Ask me questions while you tour the home.