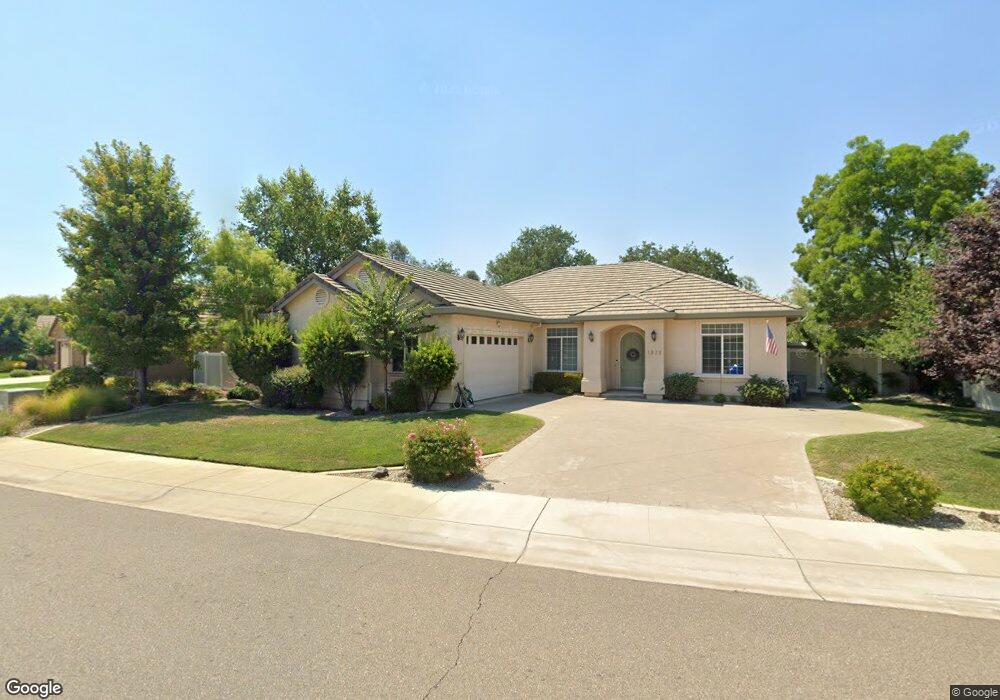
1936 Balzac Ct Unit Lot 10 Redding, CA 96003
North Shasta View NeighborhoodEstimated Value: $470,022 - $613,000
3
Beds
2
Baths
1,901
Sq Ft
$275/Sq Ft
Est. Value
About This Home
This home is located at 1936 Balzac Ct Unit Lot 10, Redding, CA 96003 and is currently estimated at $523,506, approximately $275 per square foot. 1936 Balzac Ct Unit Lot 10 is a home located in Shasta County with nearby schools including Columbia Elementary School, Mountain View Middle School, and Foothill High School.
Ownership History
Date
Name
Owned For
Owner Type
Purchase Details
Closed on
Mar 4, 2008
Sold by
Lapidus Paul A and Lapidus Cynthia E
Bought by
Lapidus Paul A and Lapidus Cynthia E
Current Estimated Value
Purchase Details
Closed on
Nov 30, 2007
Sold by
Insignia Builders Inc
Bought by
Lapidus Paul A and Lapidus Cynthia E
Home Financials for this Owner
Home Financials are based on the most recent Mortgage that was taken out on this home.
Original Mortgage
$50,000
Interest Rate
5.99%
Mortgage Type
Purchase Money Mortgage
Purchase Details
Closed on
Nov 29, 2007
Sold by
Shasta View Lake Inc
Bought by
Insignia Builders Inc
Home Financials for this Owner
Home Financials are based on the most recent Mortgage that was taken out on this home.
Original Mortgage
$50,000
Interest Rate
5.99%
Mortgage Type
Purchase Money Mortgage
Create a Home Valuation Report for This Property
The Home Valuation Report is an in-depth analysis detailing your home's value as well as a comparison with similar homes in the area
Home Values in the Area
Average Home Value in this Area
Purchase History
| Date | Buyer | Sale Price | Title Company |
|---|---|---|---|
| Lapidus Paul A | -- | None Available | |
| Lapidus Paul A | $454,000 | Placer Title Company | |
| Insignia Builders Inc | $27,500 | Placer Title Company |
Source: Public Records
Mortgage History
| Date | Status | Borrower | Loan Amount |
|---|---|---|---|
| Closed | Lapidus Paul A | $50,000 | |
| Closed | Insignia Builders Inc | $27,500 |
Source: Public Records
Tax History Compared to Growth
Tax History
| Year | Tax Paid | Tax Assessment Tax Assessment Total Assessment is a certain percentage of the fair market value that is determined by local assessors to be the total taxable value of land and additions on the property. | Land | Improvement |
|---|---|---|---|---|
| 2025 | $3,454 | $320,503 | $86,565 | $233,938 |
| 2024 | $3,462 | $314,219 | $84,868 | $229,351 |
| 2023 | $3,462 | $308,058 | $83,204 | $224,854 |
| 2022 | $3,335 | $302,019 | $81,573 | $220,446 |
| 2021 | $3,309 | $296,098 | $79,974 | $216,124 |
| 2020 | $3,164 | $293,062 | $79,154 | $213,908 |
| 2019 | $3,103 | $287,316 | $77,602 | $209,714 |
| 2018 | $3,128 | $281,683 | $76,081 | $205,602 |
| 2017 | $3,162 | $276,161 | $74,590 | $201,571 |
| 2016 | $2,913 | $270,747 | $73,128 | $197,619 |
| 2015 | $2,841 | $266,681 | $72,030 | $194,651 |
| 2014 | $2,822 | $261,459 | $70,620 | $190,839 |
Source: Public Records
Map
Nearby Homes
- 2517 Atrium Way
- 2293 Milano Trail
- 1945 Salzburg Trail
- Stacey Plan at Sonata
- Caroline Plan at Sonata
- Rosie Plan at Sonata
- Leah Plan at Sonata
- 2238 Sophy Place
- 2030 Hedgerow Ave
- 1802 Whaley Ct
- 1401 Casa Vereda Way
- 1891 Edgewood Dr
- 2531 Rainbow Ln
- 10095 Frazier Rd
- 1187 Kirkwood Cir
- 1610 Oakdale Ct
- 1703 Cascade Ln
- 2164 Oxford Rd
- 1511 Oakdale Ln
- 1565 Becky Way
- 1936 Balzac Ct
- 1924 Balzac Ct
- 1948 Balzac Ct
- 1912 Balzac Ct Unit Lot 8
- 1912 Balzac Ct
- 1960 Balzac Ct
- 1925 Balzac Ct Unit Lot 22
- 1925 Balzac Ct
- 1913 Balzac Ct Unit Lot 23
- 1913 Balzac Ct
- 1937 Balzac Ct Unit Lot 21
- 1937 Balzac Ct
- 1949 Balzac Ct
- 2335 Voltaire Way Unit Lot 24
- 2335 Voltaire Way
- 2304 Voltaire Way
- 1972 Balzac Ct
- 2324 Voltaire Way
- 1938 Jolie Way Unit LOT29
- 1938 Jolie Way