1936 Crescent Ct Hoffman Estates, IL 60169
South Hoffman Estates NeighborhoodEstimated Value: $428,000 - $506,000
About This Home
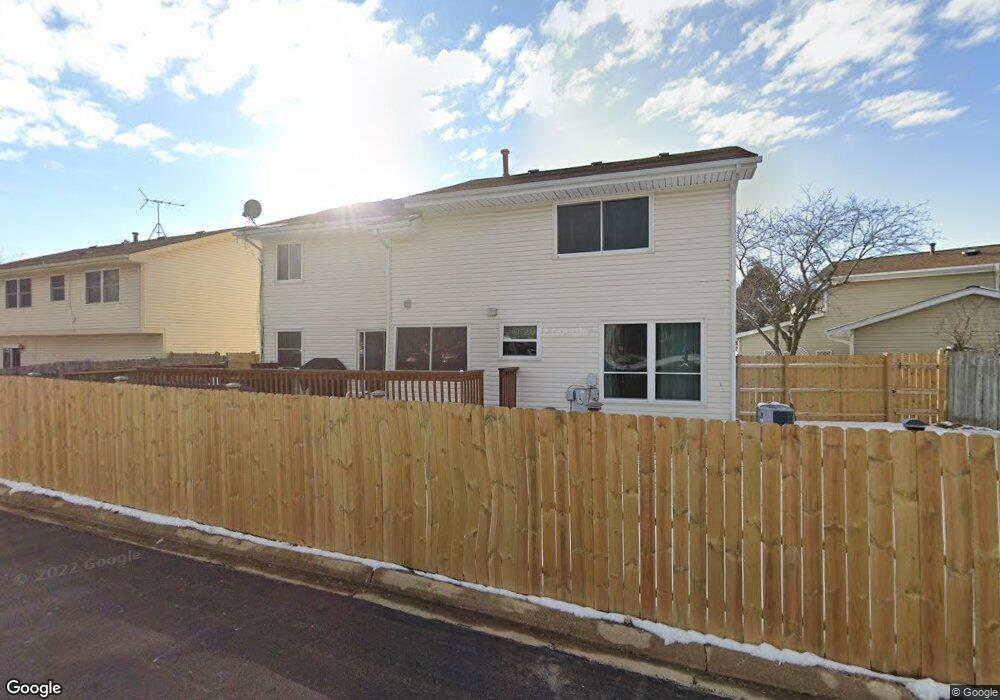
This home is located at 1936 Crescent Ct, Hoffman Estates, IL 60169 and is currently estimated at $461,356, approximately $279 per square foot. 1936 Crescent Ct is a home located in Cook County with nearby schools including Neil Armstrong Elementary School, Dwight D Eisenhower Junior High School, and Hoffman Estates High School.
Ownership History
We collect this data history from publicly available records. To have your information removed, we recommend requesting removal directly through your county’s website.
Purchase Details
Home Values in the Area
Average Home Value in this Area
Purchase History
We collect this data history from publicly available records. To have your information removed, we recommend requesting removal directly through your county’s website.
| Date | Buyer | Sale Price | Title Company |
|---|---|---|---|
| $192,000 | -- |
Tax History
We collect this data history from publicly available records. To have your information removed, we recommend requesting removal directly through your county’s website.
| Year | Tax Paid | Tax Assessment Tax Assessment Total Assessment is a certain percentage of the fair market value that is determined by local assessors to be the total taxable value of land and additions on the property. | Land | Improvement |
|---|---|---|---|---|
| 2025 | $8,803 | $38,001 | $7,211 | $30,790 |
| 2024 | $8,803 | $32,000 | $6,555 | $25,445 |
| 2023 | $8,488 | $32,000 | $6,555 | $25,445 |
| 2022 | $8,488 | $32,000 | $6,555 | $25,445 |
| 2021 | $7,024 | $24,296 | $10,324 | $13,972 |
| 2020 | $6,935 | $24,296 | $10,324 | $13,972 |
| 2019 | $6,899 | $26,996 | $10,324 | $16,672 |
| 2018 | $7,701 | $27,051 | $9,013 | $18,038 |
| 2017 | $7,583 | $27,051 | $9,013 | $18,038 |
| 2016 | $7,315 | $27,051 | $9,013 | $18,038 |
| 2015 | $6,967 | $24,314 | $7,866 | $16,448 |
| 2014 | $6,861 | $24,314 | $7,866 | $16,448 |
| 2013 | $6,667 | $24,314 | $7,866 | $16,448 |
Map
- 1375 Rebecca Dr Unit 302
- 1475 Rebecca Dr Unit 422
- 1475 Rebecca Dr Unit 418
- 1880 Bonnie Ln Unit 203
- 1500 Robin Cir Unit 314
- 1688 Queensbury Cir Unit 5874
- 1661 Carmel Ct Unit 3
- 1751 Pebble Beach Dr
- 1814 Sessions Walk Unit 1814
- 1796 Fayette Walk Unit F
- 1804 Fayette Walk Unit G
- 2216 Seaver Ln Unit 2
- 2207 Seaver Ln
- 1793 Queensbury Cir
- 1724 Fayette Walk Unit F
- 1975 Windsong Dr Unit 333E1
- 1796 Queensbury Cir
- 1729 Pebble Beach Ct
- 1726 Sessions Walk Unit 1726
- 1840 Huntington Blvd Unit BW511
- 1938 Crescent Ct
- 1934 Crescent Ct
- 1940 Crescent Ct
- 1932 Crescent Ct
- 1942 Crescent Ct
- 1930 Crescent Ct
- 1920 Crescent Ln
- 1944 Crescent Ct
- 1946 Crescent Ct
- 1948 Crescent Ct
- 1910 Crescent Ln
- 1900 Crescent Ln
- 1954 Crescent Ln
- 1950 Crescent Ln
- 1890 Crescent Ln
- 1958 Crescent Ln
- 1935 Crescent Ln
- 1941 Crescent Ln
- 1925 Crescent Ln
- 1880 Crescent Ln
Ask me questions while you tour the home.