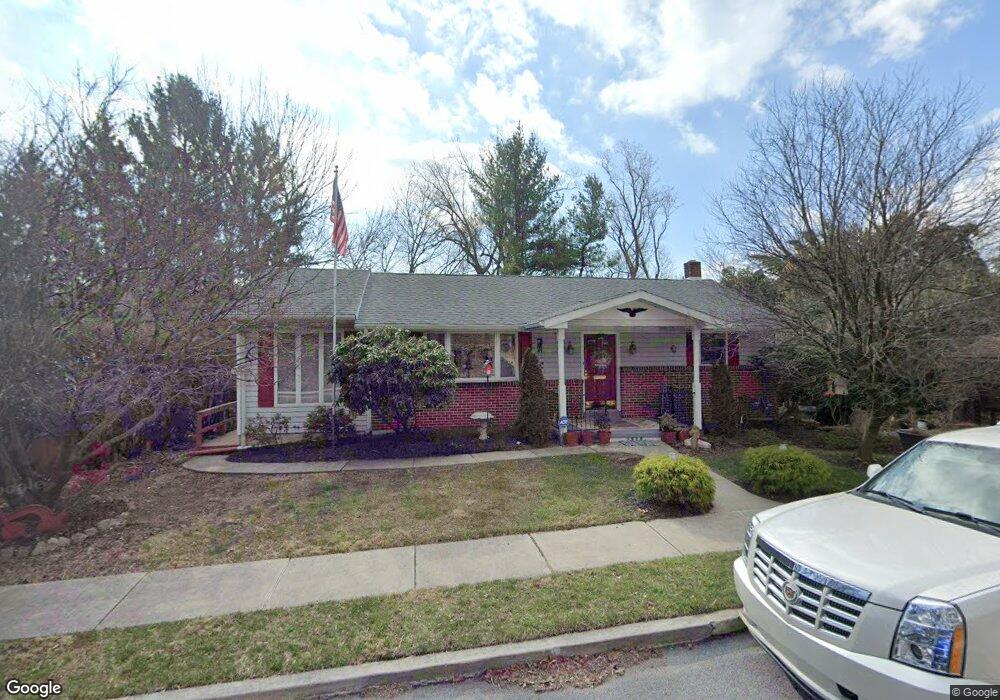
1936 Steuben Rd Reading, PA 19602
East Reading NeighborhoodEstimated Value: $228,000 - $438,000
2
Beds
2
Baths
1,408
Sq Ft
$212/Sq Ft
Est. Value
About This Home
This home is located at 1936 Steuben Rd, Reading, PA 19602 and is currently estimated at $298,333, approximately $211 per square foot. 1936 Steuben Rd is a home located in Berks County with nearby schools including 16th & Haak Elementary School, Central Middle School, and Reading Senior High School.
Ownership History
Date
Name
Owned For
Owner Type
Purchase Details
Closed on
Mar 14, 2005
Sold by
Himes David W and Himes Heather J
Bought by
Spinka Warren and Spinka Sara Ann
Current Estimated Value
Home Financials for this Owner
Home Financials are based on the most recent Mortgage that was taken out on this home.
Original Mortgage
$55,000
Interest Rate
5.94%
Mortgage Type
Fannie Mae Freddie Mac
Purchase Details
Closed on
Sep 9, 2004
Sold by
Wolski Albert J and Wolski Mary E
Bought by
Himes David W and Himes Heather J
Home Financials for this Owner
Home Financials are based on the most recent Mortgage that was taken out on this home.
Original Mortgage
$138,902
Interest Rate
5.66%
Mortgage Type
FHA
Create a Home Valuation Report for This Property
The Home Valuation Report is an in-depth analysis detailing your home's value as well as a comparison with similar homes in the area
Home Values in the Area
Average Home Value in this Area
Purchase History
| Date | Buyer | Sale Price | Title Company |
|---|---|---|---|
| Spinka Warren | $148,000 | -- | |
| Himes David W | $140,000 | -- |
Source: Public Records
Mortgage History
| Date | Status | Borrower | Loan Amount |
|---|---|---|---|
| Previous Owner | Spinka Warren | $55,000 | |
| Previous Owner | Himes David W | $138,902 |
Source: Public Records
Tax History Compared to Growth
Tax History
| Year | Tax Paid | Tax Assessment Tax Assessment Total Assessment is a certain percentage of the fair market value that is determined by local assessors to be the total taxable value of land and additions on the property. | Land | Improvement |
|---|---|---|---|---|
| 2025 | $2,722 | $100,300 | $23,200 | $77,100 |
| 2024 | $4,454 | $100,300 | $23,200 | $77,100 |
| 2023 | $4,385 | $100,300 | $23,200 | $77,100 |
| 2022 | $4,385 | $100,300 | $23,200 | $77,100 |
| 2021 | $4,385 | $100,300 | $23,200 | $77,100 |
| 2020 | $4,341 | $100,300 | $23,200 | $77,100 |
| 2019 | $4,341 | $100,300 | $23,200 | $77,100 |
| 2018 | $4,341 | $100,300 | $23,200 | $77,100 |
| 2017 | $4,312 | $100,300 | $23,200 | $77,100 |
| 2016 | $2,463 | $100,300 | $23,200 | $77,100 |
| 2015 | $2,463 | $100,300 | $23,200 | $77,100 |
| 2014 | $2,267 | $100,300 | $23,200 | $77,100 |
Source: Public Records
Map
Nearby Homes
- 0 Trooper Rd
- 1810 Holly Rd
- 1849 Perkiomen Ave
- 330 S 17 1/2 St
- 314 S 17th St
- 1711 Perkiomen Ave
- 300 Friedensburg Rd
- 2135 R Dengler St
- 261 Friedensburg Rd
- 1725 Cotton St
- 2201 & 2207 Perkiomen Ave
- 516 Fountain Ave
- 629 - 633 S 18th St
- 1536 Mineral Spring Rd
- 1535 Haak St
- 1642 Muhlenberg St
- 1634 Muhlenberg St
- 108 Kuechler Ct
- 1653 Cotton St
- 520 S 17 1/2 St
- 1946 Steuben Rd
- 1910 Trooper Rd
- 1920 Steuben Rd
- 1913 Steuben Rd
- 1900 Trooper Rd
- 1903 Trooper Rd
- 1901 Trooper Rd
- 1909 Steuben Rd
- 2000 Steuben Rd
- 2011 Trooper Rd
- 2001 Steuben Rd
- 1910 Steuben Rd
- 2002 Steuben Rd
- 2002 Trooper Rd
- 1900 Hill Rd
- 2004 Steuben Rd
- 1982 Hessian Rd
- 1813 Steuben Rd
- 2003 Steuben Rd
- 1810 Hill Rd