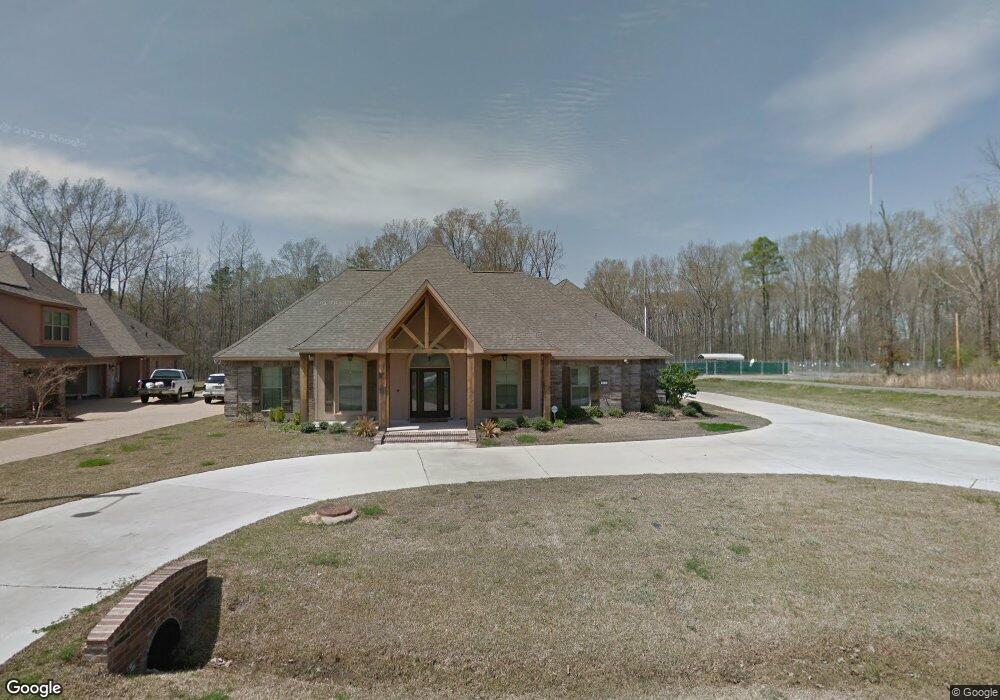
1937 Highpoint Place Haughton, LA 71037
Eastwood NeighborhoodEstimated Value: $475,000 - $514,000
4
Beds
3
Baths
2,867
Sq Ft
$172/Sq Ft
Est. Value
About This Home
This home is located at 1937 Highpoint Place, Haughton, LA 71037 and is currently estimated at $491,797, approximately $171 per square foot. 1937 Highpoint Place is a home with nearby schools including T.L. Rodes Elementary School, Platt Elementary School, and Princeton Elementary School.
Ownership History
Date
Name
Owned For
Owner Type
Purchase Details
Closed on
Jun 27, 2014
Sold by
Fallin William Ray and Fallin Lacy Leigh Rosier
Bought by
Almond Robert Craig and Almond Mary Martin
Current Estimated Value
Home Financials for this Owner
Home Financials are based on the most recent Mortgage that was taken out on this home.
Original Mortgage
$376,000
Interest Rate
4.12%
Mortgage Type
VA
Purchase Details
Closed on
Jul 9, 2012
Sold by
Dmkc Inc
Bought by
Fallin William Ray and Fallin Lacy Leigh Rosier
Home Financials for this Owner
Home Financials are based on the most recent Mortgage that was taken out on this home.
Original Mortgage
$369,075
Interest Rate
3.7%
Mortgage Type
Unknown
Purchase Details
Closed on
Aug 12, 2011
Sold by
Kennon Steven Christopher and Kennon Stephanie Tolbert
Bought by
Dmkc Inc
Home Financials for this Owner
Home Financials are based on the most recent Mortgage that was taken out on this home.
Original Mortgage
$45,495
Interest Rate
4.53%
Mortgage Type
Future Advance Clause Open End Mortgage
Create a Home Valuation Report for This Property
The Home Valuation Report is an in-depth analysis detailing your home's value as well as a comparison with similar homes in the area
Home Values in the Area
Average Home Value in this Area
Purchase History
| Date | Buyer | Sale Price | Title Company |
|---|---|---|---|
| Almond Robert Craig | $376,000 | Magnolia Title Services Llc | |
| Fallin William Ray | $388,500 | None Available | |
| Dmkc Inc | -- | None Available |
Source: Public Records
Mortgage History
| Date | Status | Borrower | Loan Amount |
|---|---|---|---|
| Previous Owner | Almond Robert Craig | $376,000 | |
| Previous Owner | Fallin William Ray | $369,075 | |
| Previous Owner | Dmkc Inc | $45,495 |
Source: Public Records
Tax History Compared to Growth
Tax History
| Year | Tax Paid | Tax Assessment Tax Assessment Total Assessment is a certain percentage of the fair market value that is determined by local assessors to be the total taxable value of land and additions on the property. | Land | Improvement |
|---|---|---|---|---|
| 2024 | $3,995 | $42,422 | $5,200 | $37,222 |
| 2023 | $3,371 | $34,745 | $3,950 | $30,795 |
| 2022 | $3,352 | $34,745 | $3,950 | $30,795 |
| 2021 | $3,352 | $34,745 | $3,950 | $30,795 |
| 2020 | $3,352 | $34,745 | $3,950 | $30,795 |
| 2019 | $3,434 | $35,070 | $3,800 | $31,270 |
| 2018 | $3,434 | $35,070 | $3,800 | $31,270 |
| 2017 | $3,391 | $35,070 | $3,800 | $31,270 |
| 2016 | $3,391 | $35,070 | $3,800 | $31,270 |
| 2015 | $3,174 | $34,880 | $3,800 | $31,080 |
| 2014 | $3,174 | $34,880 | $3,800 | $31,080 |
Source: Public Records
Map
Nearby Homes
- 1940 Honeytree Trail
- 2117 Forest Hills Blvd
- 2200 Grapevine Ln
- 2228 Grapevine Ln
- 2805 Clearbrook Way
- 2549 Bloomfield Ln
- 213 Whispering Pine Dr
- 3030 Sagefield Ln
- 2816 Sunrise Point
- 2115 Hollow Wood Way
- 506 Whispering Pine Cir
- 4705 Highway 80 Unit 1
- 615 Lawrence Dr
- 109 Flagg Dr
- 105 Flagg Dr
- 123 Taylor Bend St
- 212 Sweetgum Dr
- 109 S Meadow Ln
- 128 Taylor Bend St
- 129 Chimney Ln
- 1935 Highpoint Place
- 1936 Highpoint Place
- 1933 Highpoint Place
- 1934 Highpoint Place
- 1947 Highpoint Place
- 1931 Highpoint Place
- 1932 Highpoint Place
- 1951 Highpoint Place
- 1708 Turning Leaf Trail
- 1929 Highpoint Place
- 1955 Highpoint Place
- 1712 Turning Leaf Trail
- 1705 Turning Leaf Trail
- 1709 Turning Leaf Trail
- 1701 Turning Leaf Trail
- 1716 Turning Leaf Trail
- 1959 Highpoint Place
- 1713 Turning Leaf Trail
- 1924 Highpoint Place
- 1923 Highpoint Place