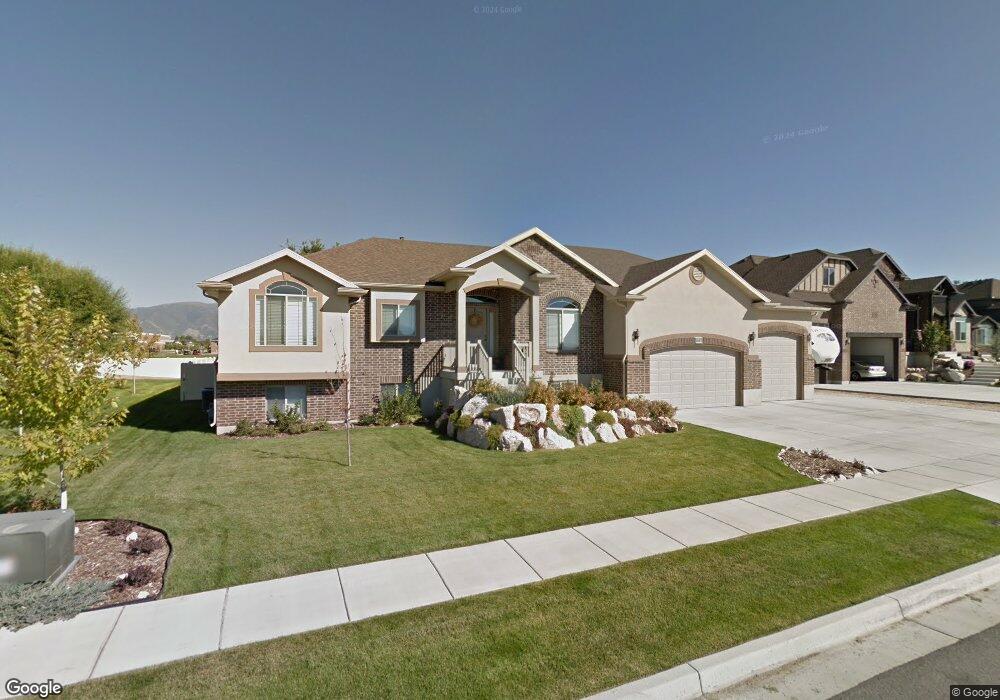
1937 S 2150 W Syracuse, UT 84075
Estimated Value: $670,000 - $779,000
4
Beds
4
Baths
4,112
Sq Ft
$179/Sq Ft
Est. Value
About This Home
This home is located at 1937 S 2150 W, Syracuse, UT 84075 and is currently estimated at $734,367, approximately $178 per square foot. 1937 S 2150 W is a home located in Davis County with nearby schools including Syracuse Elementary School, Syracuse Junior High School, and Syracuse High School.
Ownership History
Date
Name
Owned For
Owner Type
Purchase Details
Closed on
Oct 2, 2008
Sold by
Castle Creek Homes Llc
Bought by
Page Phillip C and Page Cora G
Current Estimated Value
Home Financials for this Owner
Home Financials are based on the most recent Mortgage that was taken out on this home.
Original Mortgage
$361,005
Outstanding Balance
$239,082
Interest Rate
6.43%
Mortgage Type
VA
Estimated Equity
$495,285
Purchase Details
Closed on
Feb 6, 2008
Sold by
Mike Schultz Construction Inc
Bought by
Castle Creek Homes Llc
Home Financials for this Owner
Home Financials are based on the most recent Mortgage that was taken out on this home.
Original Mortgage
$291,588
Interest Rate
5.65%
Mortgage Type
Construction
Create a Home Valuation Report for This Property
The Home Valuation Report is an in-depth analysis detailing your home's value as well as a comparison with similar homes in the area
Home Values in the Area
Average Home Value in this Area
Purchase History
| Date | Buyer | Sale Price | Title Company |
|---|---|---|---|
| Page Phillip C | -- | Mountain View Title & Escrow | |
| Castle Creek Homes Llc | -- | Heritage West Title Ins Agen |
Source: Public Records
Mortgage History
| Date | Status | Borrower | Loan Amount |
|---|---|---|---|
| Open | Page Phillip C | $361,005 | |
| Previous Owner | Castle Creek Homes Llc | $291,588 |
Source: Public Records
Tax History
| Year | Tax Paid | Tax Assessment Tax Assessment Total Assessment is a certain percentage of the fair market value that is determined by local assessors to be the total taxable value of land and additions on the property. | Land | Improvement |
|---|---|---|---|---|
| 2025 | -- | $436,700 | $127,403 | $309,297 |
| 2024 | -- | $409,200 | $107,735 | $301,465 |
| 2023 | $2,444 | $698,000 | $149,979 | $548,021 |
| 2022 | $2,444 | $407,550 | $86,006 | $321,544 |
| 2021 | $1,613 | $543,000 | $127,369 | $415,631 |
| 2020 | $1,187 | $469,000 | $109,762 | $359,238 |
| 2019 | $2,494 | $455,000 | $108,745 | $346,255 |
| 2018 | $2,608 | $419,000 | $104,238 | $314,762 |
| 2016 | $2,529 | $214,335 | $39,955 | $174,380 |
| 2015 | $2,968 | $211,200 | $39,955 | $171,245 |
| 2014 | $2,569 | $211,177 | $39,955 | $171,222 |
| 2013 | -- | $237,157 | $33,678 | $203,479 |
Source: Public Records
Map
Nearby Homes
- 2138 Craig Ln
- 4344 W 1825 S Unit 102
- 4354 W 1825 S Unit 104
- 2329 W 1700 S
- 2104 W 2200 S
- 2475 Craig Ln
- 1782 W 1700 S
- 1996 S 1675 W
- 1826 W 2350 S
- 2679 W Antelope Dr
- 1876 W 2400 S
- 2013 S 1575 W
- 1720 W 1400 S
- 1686 W 2425 S
- 2803 W 2025 S
- 1283 W 2375 S
- 2574 S 2430 W Unit 503
- 2594 S 2430 W Unit 501
- 2653 S 2430 W Unit 115
- 2584 S 2430 St W Unit 502
Your Personal Tour Guide
Ask me questions while you tour the home.