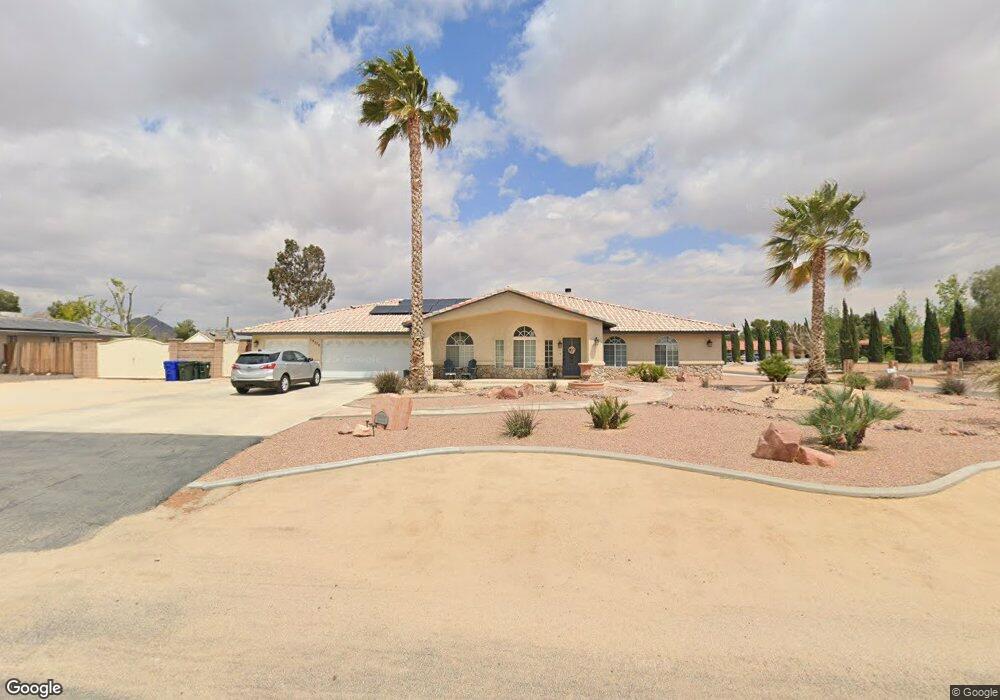
19370 Oneida Rd Apple Valley, CA 92307
High Desert NeighborhoodEstimated Value: $646,494 - $687,000
5
Beds
3
Baths
3,168
Sq Ft
$210/Sq Ft
Est. Value
About This Home
This home is located at 19370 Oneida Rd, Apple Valley, CA 92307 and is currently estimated at $665,374, approximately $210 per square foot. 19370 Oneida Rd is a home located in San Bernardino County with nearby schools including Rio Vista School of Applied Learning, Granite Hills High School, and Academy for Academic Excellence.
Ownership History
Date
Name
Owned For
Owner Type
Purchase Details
Closed on
Mar 24, 2014
Sold by
Pringle David G and Pringle Shannon M
Bought by
Hatcher Billy
Current Estimated Value
Home Financials for this Owner
Home Financials are based on the most recent Mortgage that was taken out on this home.
Original Mortgage
$393,277
Outstanding Balance
$297,409
Interest Rate
4.28%
Mortgage Type
VA
Estimated Equity
$367,965
Purchase Details
Closed on
May 12, 2000
Sold by
Rylar Investments Inc
Bought by
Pringle David G
Home Financials for this Owner
Home Financials are based on the most recent Mortgage that was taken out on this home.
Original Mortgage
$139,500
Interest Rate
8.27%
Mortgage Type
Purchase Money Mortgage
Purchase Details
Closed on
Sep 13, 1999
Sold by
Burnley Charles and Burnley Mojester
Bought by
Rylar Investments Inc
Create a Home Valuation Report for This Property
The Home Valuation Report is an in-depth analysis detailing your home's value as well as a comparison with similar homes in the area
Home Values in the Area
Average Home Value in this Area
Purchase History
| Date | Buyer | Sale Price | Title Company |
|---|---|---|---|
| Hatcher Billy | $387,500 | Chicago Title Company | |
| Pringle David G | $219,500 | First American Title Ins Co | |
| Rylar Investments Inc | $35,000 | First American Title Ins Co |
Source: Public Records
Mortgage History
| Date | Status | Borrower | Loan Amount |
|---|---|---|---|
| Open | Hatcher Billy | $393,277 | |
| Previous Owner | Pringle David G | $139,500 |
Source: Public Records
Tax History Compared to Growth
Tax History
| Year | Tax Paid | Tax Assessment Tax Assessment Total Assessment is a certain percentage of the fair market value that is determined by local assessors to be the total taxable value of land and additions on the property. | Land | Improvement |
|---|---|---|---|---|
| 2025 | $5,487 | $475,020 | $95,002 | $380,018 |
| 2024 | $5,332 | $465,706 | $93,139 | $372,567 |
| 2023 | $5,285 | $456,575 | $91,313 | $365,262 |
| 2022 | $5,205 | $447,623 | $89,523 | $358,100 |
| 2021 | $5,086 | $438,846 | $87,768 | $351,078 |
| 2020 | $5,025 | $434,346 | $86,868 | $347,478 |
| 2019 | $4,933 | $425,830 | $85,165 | $340,665 |
| 2018 | $4,811 | $417,480 | $83,495 | $333,985 |
| 2017 | $4,746 | $409,294 | $81,858 | $327,436 |
| 2016 | $4,607 | $401,269 | $80,253 | $321,016 |
| 2015 | $4,539 | $395,242 | $79,048 | $316,194 |
| 2014 | $3,527 | $312,283 | $43,883 | $268,400 |
Source: Public Records
Map
Nearby Homes
- 19345 Oneida Rd
- 14685 Apple Valley Rd
- 14636 Choco Rd
- 14580 Keota Rd
- 14798 Keota Rd
- 19655 Seneca Rd
- 14610 Havasu Rd
- 15023 Genesee Rd
- 19215 Hupa Rd
- 19501 Kinai Rd
- 19678 Red Feather Rd
- 14455 Havasu Rd
- 14705 Mandan Rd
- 0 Choco Rd Unit HD24105766
- 0 Choco Rd Unit HD25067276
- 15128 Mendota Rd
- 19446 Shoshonee Rd
- 14171 Tehachapi Rd
- 14305 Bochee Rd
- 19804 Haida Rd
- 19360 Oneida Rd
- 14710 Genesee Rd
- 14665 Genesee Rd
- 19365 Oneida Rd
- 14675 Genesee Rd
- 19375 Oneida Rd
- 19355 Oneida Rd
- 14685 Genesee Rd
- 14730 Genesee Rd
- 14705 Genesee Rd
- 19338 Oneida Rd
- 19390 Oneida Rd
- 14725 Genesee Rd
- 19320 Tewa Rd
- 14750 Genesee Rd
- 19308 Tewa Rd
- 19395 Oneida Rd
- 19328 Oneida Rd
- 19335 Oneida Rd
- 14745 Genesee Rd