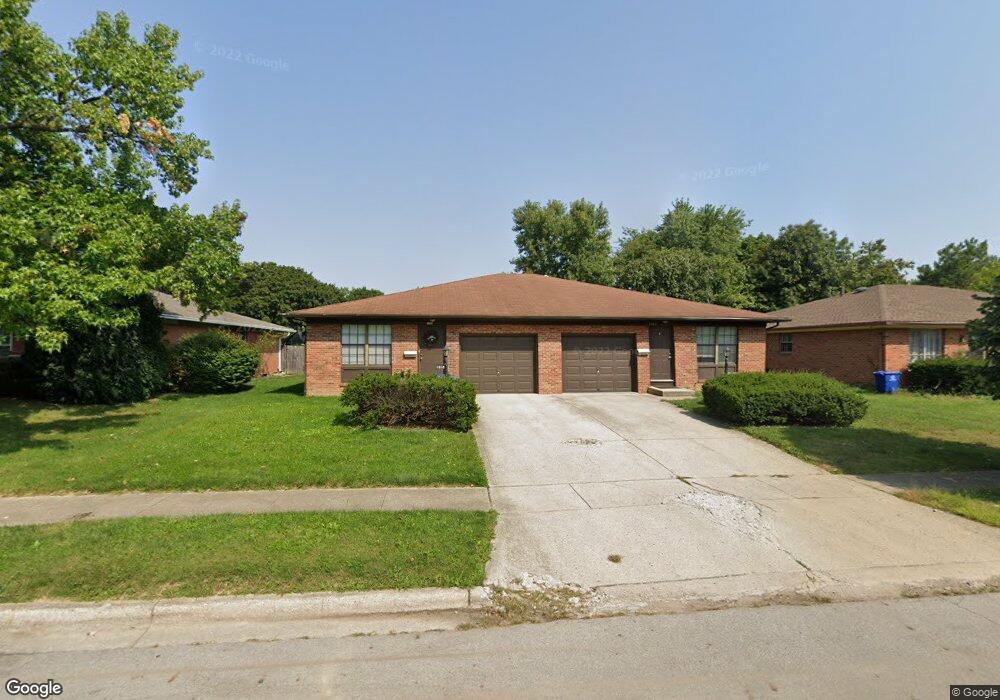
1938-1940 Hampstead Dr Columbus, OH 43229
Northgate NeighborhoodEstimated Value: $316,000 - $408,000
2
Beds
2
Baths
2,260
Sq Ft
$154/Sq Ft
Est. Value
About This Home
This home is located at 1938-1940 Hampstead Dr, Columbus, OH 43229 and is currently estimated at $347,048, approximately $153 per square foot. 1938-1940 Hampstead Dr is a home located in Franklin County with nearby schools including Alpine Elementary School, Northgate Intermediate, and Woodward Park Middle School.
Ownership History
Date
Name
Owned For
Owner Type
Purchase Details
Closed on
Nov 9, 2021
Sold by
Nhgc Llc
Bought by
Brown Ryan
Current Estimated Value
Home Financials for this Owner
Home Financials are based on the most recent Mortgage that was taken out on this home.
Original Mortgage
$232,000
Outstanding Balance
$210,983
Interest Rate
3.05%
Mortgage Type
New Conventional
Estimated Equity
$136,065
Purchase Details
Closed on
Aug 7, 2018
Sold by
Callicoat Gary L and Callicoat Shelley A
Bought by
Nhgc Llc
Purchase Details
Closed on
Jul 6, 2017
Sold by
Babione Todd V and Babione Sandra J
Bought by
Callicoat Gary L and Callicoat Shelley A
Home Financials for this Owner
Home Financials are based on the most recent Mortgage that was taken out on this home.
Original Mortgage
$127,500
Interest Rate
3.95%
Mortgage Type
New Conventional
Purchase Details
Closed on
Oct 27, 1971
Bought by
Babione Sandra J
Create a Home Valuation Report for This Property
The Home Valuation Report is an in-depth analysis detailing your home's value as well as a comparison with similar homes in the area
Home Values in the Area
Average Home Value in this Area
Purchase History
| Date | Buyer | Sale Price | Title Company |
|---|---|---|---|
| Brown Ryan | $290,000 | Associates Title Inc | |
| Nhgc Llc | -- | None Available | |
| Callicoat Gary L | $170,000 | None Available | |
| Babione Sandra J | -- | -- |
Source: Public Records
Mortgage History
| Date | Status | Borrower | Loan Amount |
|---|---|---|---|
| Open | Brown Ryan | $232,000 | |
| Previous Owner | Callicoat Gary L | $127,500 |
Source: Public Records
Tax History
| Year | Tax Paid | Tax Assessment Tax Assessment Total Assessment is a certain percentage of the fair market value that is determined by local assessors to be the total taxable value of land and additions on the property. | Land | Improvement |
|---|---|---|---|---|
| 2025 | $4,825 | $105,290 | $24,120 | $81,170 |
| 2024 | $4,825 | $105,290 | $24,120 | $81,170 |
| 2023 | $4,765 | $105,280 | $24,115 | $81,165 |
| 2022 | $3,274 | $58,380 | $12,950 | $45,430 |
| 2021 | $3,108 | $58,380 | $12,950 | $45,430 |
| 2020 | $3,113 | $58,380 | $12,950 | $45,430 |
| 2019 | $2,903 | $46,690 | $10,360 | $36,330 |
| 2018 | $2,949 | $46,690 | $10,360 | $36,330 |
| 2017 | $2,903 | $46,690 | $10,360 | $36,330 |
| 2016 | $3,289 | $47,680 | $10,330 | $37,350 |
| 2015 | $2,999 | $47,680 | $10,330 | $37,350 |
| 2014 | $2,956 | $47,680 | $10,330 | $37,350 |
| 2013 | $1,648 | $52,990 | $11,480 | $41,510 |
Source: Public Records
Map
Nearby Homes
- 6019 Beechcroft Rd
- 5885 Beechcroft Rd Unit 306
- 5885 Beechcroft Rd Unit 313
- 6148 Sharon Woods Blvd
- 6166 Harrington Ct
- 6245 Sharon Woods Blvd
- 1852 Balsamridge Rd
- 5720 Beechcroft Rd Unit B
- 5732 Beechcroft Rd Unit B
- 5705 Tamarack Blvd Unit F
- 6035 Karl Rd
- 2197 Bayfield Dr
- 2125 Keltonshire Ave
- 6048 Pinemoor St
- 2154-2156 Jewett Dr
- 6425 Deer Ridge Ln
- 6233 Karl Rd
- 2292 Laurelwood Dr Unit 2292L
- 6348 Birkewood St
- 1687 Brookfield Square S
- 1938 Hampstead Dr Unit 940
- 1938 -1940 Hampstead Dr
- 1950 Hampstead Dr Unit 952
- 1930 Hampstead Dr Unit 932
- 1952 Hampstead Dr
- 1922-1924 Hampstead Dr
- 1922 Hampstead Dr Unit 924
- 1929 Fairhaven Rd
- 6035 Clintonview St
- 6043 Clintonview St
- 6019 Clintonview St
- 1966 Hampstead Dr Unit 968
- 1966-1968 Hampstead Dr
- 1941 Hampstead Dr Unit 943
- 1941 Hampstead Dr Unit 2
- 1933 Hampstead Dr Unit 935
- 1933-1935 Hampstead Dr
- 1937 Fairhaven Rd
- 1921 Fairhaven Rd
- 1955 Hampstead Dr Unit 957
Your Personal Tour Guide
Ask me questions while you tour the home.