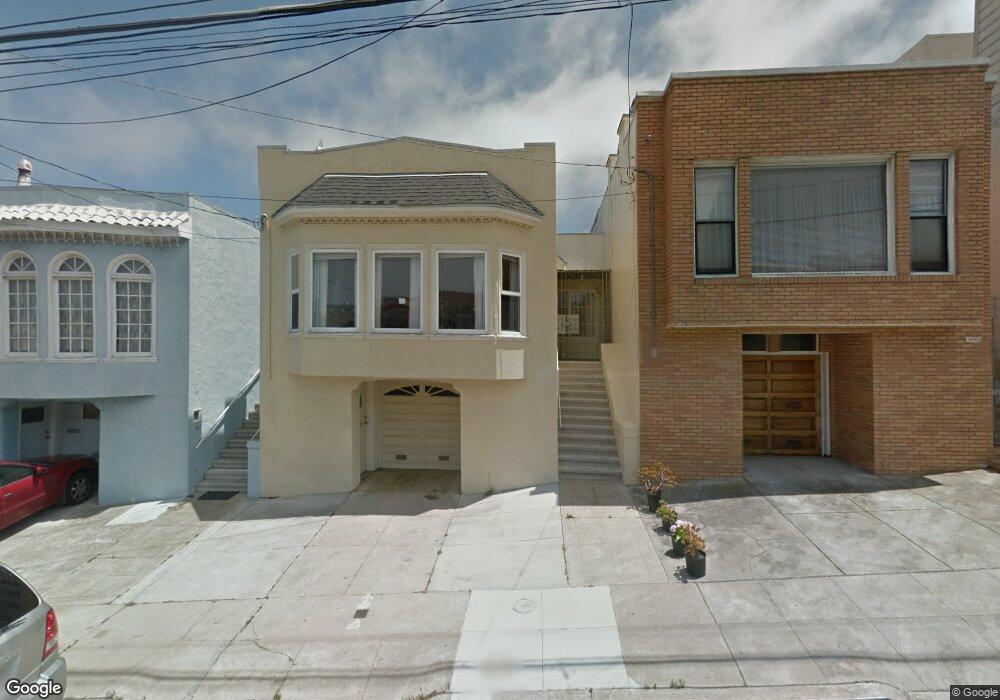
1938 21st Ave San Francisco, CA 94116
Parkside NeighborhoodEstimated Value: $1,162,000 - $1,484,000
2
Beds
1
Bath
1,397
Sq Ft
$957/Sq Ft
Est. Value
About This Home
This home is located at 1938 21st Ave, San Francisco, CA 94116 and is currently estimated at $1,337,555, approximately $957 per square foot. 1938 21st Ave is a home located in San Francisco County with nearby schools including Jefferson Elementary School, Giannini (A.P.) Middle School, and Cornerstone Academy-Lawton Campus.
Ownership History
Date
Name
Owned For
Owner Type
Purchase Details
Closed on
Sep 5, 2016
Sold by
Kishi Helen
Bought by
Kishi Helen
Current Estimated Value
Purchase Details
Closed on
May 14, 2009
Sold by
Gershman Yevgenly and Gershman Vladislav
Bought by
Gershman Yevgenly and Gershman Yegvenya
Home Financials for this Owner
Home Financials are based on the most recent Mortgage that was taken out on this home.
Original Mortgage
$417,000
Outstanding Balance
$263,044
Interest Rate
4.82%
Mortgage Type
New Conventional
Estimated Equity
$1,074,511
Purchase Details
Closed on
Nov 14, 2007
Sold by
Chung William and Chung Letitia
Bought by
Kishi Hiroshi and Kishi Helen
Purchase Details
Closed on
Nov 10, 2007
Sold by
Chuck Annie and Chuck William
Bought by
Kishi Helen
Purchase Details
Closed on
Jul 21, 2003
Sold by
Chung David S C
Bought by
Chung David S C
Purchase Details
Closed on
Jun 11, 2003
Sold by
Kishi Hiroshi and Kishi Helen
Bought by
Kishi Hiroshi and Kishi Helen
Create a Home Valuation Report for This Property
The Home Valuation Report is an in-depth analysis detailing your home's value as well as a comparison with similar homes in the area
Home Values in the Area
Average Home Value in this Area
Purchase History
| Date | Buyer | Sale Price | Title Company |
|---|---|---|---|
| Kishi Helen | -- | None Available | |
| Gershman Yevgenly | -- | Fidelity National Title Co | |
| Kishi Hiroshi | -- | None Available | |
| Kishi Hiroshi | $152,000 | None Available | |
| Kishi Helen | -- | None Available | |
| Chung David S C | -- | -- | |
| Kishi Hiroshi | -- | -- | |
| Kishi Hiroshi | -- | -- |
Source: Public Records
Mortgage History
| Date | Status | Borrower | Loan Amount |
|---|---|---|---|
| Open | Gershman Yevgenly | $417,000 |
Source: Public Records
Tax History Compared to Growth
Tax History
| Year | Tax Paid | Tax Assessment Tax Assessment Total Assessment is a certain percentage of the fair market value that is determined by local assessors to be the total taxable value of land and additions on the property. | Land | Improvement |
|---|---|---|---|---|
| 2025 | $5,431 | $394,894 | $297,548 | $97,346 |
| 2024 | $5,431 | $387,151 | $291,714 | $95,437 |
| 2023 | $5,296 | $379,560 | $285,994 | $93,566 |
| 2022 | $5,175 | $372,117 | $280,386 | $91,731 |
| 2021 | $5,080 | $364,820 | $274,888 | $89,932 |
| 2020 | $5,170 | $361,079 | $272,069 | $89,010 |
| 2019 | $5,000 | $353,999 | $266,734 | $87,265 |
| 2018 | $4,832 | $347,058 | $261,504 | $85,554 |
| 2017 | $4,478 | $340,252 | $256,376 | $83,876 |
| 2016 | $4,378 | $333,584 | $251,351 | $82,233 |
| 2015 | $4,320 | $328,578 | $247,577 | $81,001 |
| 2014 | $4,209 | $322,145 | $242,729 | $79,416 |
Source: Public Records
Map
Nearby Homes
- 1200 Ortega St Unit 1202
- 1822 19th Ave Unit 1
- 1822 19th Ave
- 1822 19th Ave Unit 2
- 2050 22nd Ave
- 1815 18th Ave
- 2114 20th Ave
- 1883-1885 16th Ave
- 2116 18th Ave
- 1983 15th Ave
- 1688 20th Ave Unit 1688
- 2021 14th Ave
- 2211 19th Ave
- 1646 19th Ave
- 1678 24th Ave
- 1826 Moraga St
- 2123 Funston Ave
- 2319-2321 21st Ave
- 1701 Funston Ave Unit 1703
- 2292 16th Ave