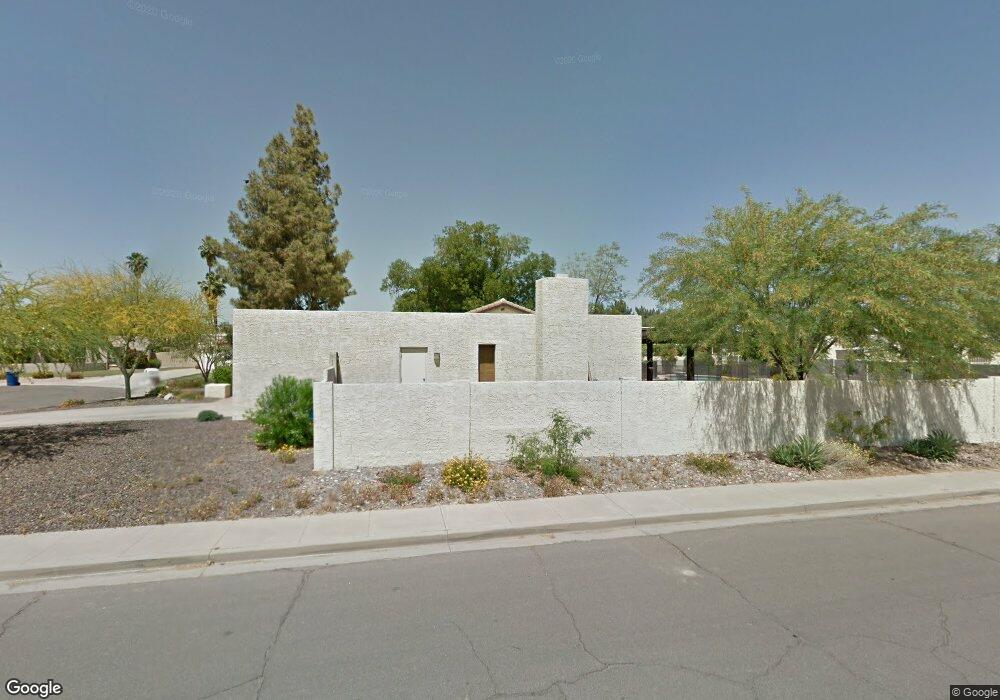
1938 E Redfield Rd Tempe, AZ 85283
South Tempe NeighborhoodEstimated Value: $634,756 - $798,000
Studio
2
Baths
2,434
Sq Ft
$295/Sq Ft
Est. Value
About This Home
This home is located at 1938 E Redfield Rd, Tempe, AZ 85283 and is currently estimated at $718,439, approximately $295 per square foot. 1938 E Redfield Rd is a home located in Maricopa County with nearby schools including Kyrene del Norte School, Kyrene de los Niños Elementary School, and Kyrene Middle School.
Ownership History
Date
Name
Owned For
Owner Type
Purchase Details
Closed on
Aug 11, 2020
Sold by
Wilson Randolph and Wilson Susan P
Bought by
Wilson Randolph and Wilson Susan Petit
Current Estimated Value
Purchase Details
Closed on
Jul 12, 2013
Sold by
Wilson Randolph and Wilson Susan P
Bought by
Wilson Randolph and Wilson Susan P
Home Financials for this Owner
Home Financials are based on the most recent Mortgage that was taken out on this home.
Original Mortgage
$100,000
Outstanding Balance
$23,714
Interest Rate
3.98%
Mortgage Type
New Conventional
Estimated Equity
$694,725
Purchase Details
Closed on
Jan 19, 2011
Sold by
Wilson Randolph and Wilson Susan P
Bought by
Wilson Randolph and Wilson Susan P
Purchase Details
Closed on
Jul 20, 1998
Sold by
Merrick James W and Merrick Georgia L
Bought by
Wilson Randolph and Wilson Susan P
Home Financials for this Owner
Home Financials are based on the most recent Mortgage that was taken out on this home.
Original Mortgage
$162,400
Interest Rate
7.01%
Mortgage Type
New Conventional
Create a Home Valuation Report for This Property
The Home Valuation Report is an in-depth analysis detailing your home's value as well as a comparison with similar homes in the area
Home Values in the Area
Average Home Value in this Area
Purchase History
| Date | Buyer | Sale Price | Title Company |
|---|---|---|---|
| Wilson Randolph | -- | None Available | |
| Wilson Randolph | -- | None Available | |
| Wilson Randolph | -- | None Available | |
| Wilson Randolph | $203,000 | Chicago Title Insurance Co |
Source: Public Records
Mortgage History
| Date | Status | Borrower | Loan Amount |
|---|---|---|---|
| Open | Wilson Randolph | $100,000 | |
| Closed | Wilson Randolph | $162,400 |
Source: Public Records
Tax History
| Year | Tax Paid | Tax Assessment Tax Assessment Total Assessment is a certain percentage of the fair market value that is determined by local assessors to be the total taxable value of land and additions on the property. | Land | Improvement |
|---|---|---|---|---|
| 2025 | $3,513 | $37,593 | -- | -- |
| 2024 | $3,312 | $35,803 | -- | -- |
| 2023 | $3,312 | $55,350 | $11,070 | $44,280 |
| 2022 | $3,140 | $41,010 | $8,200 | $32,810 |
| 2021 | $3,263 | $38,280 | $7,650 | $30,630 |
| 2020 | $3,185 | $36,510 | $7,300 | $29,210 |
| 2019 | $3,084 | $33,650 | $6,730 | $26,920 |
| 2018 | $2,981 | $31,270 | $6,250 | $25,020 |
| 2017 | $2,858 | $29,470 | $5,890 | $23,580 |
| 2016 | $2,898 | $29,610 | $5,920 | $23,690 |
| 2015 | $2,677 | $26,520 | $5,300 | $21,220 |
Source: Public Records
Map
Nearby Homes
- 1938 E Diamond Dr
- 1943 E Diamond Dr
- 2031 E Vaughn St
- 6517 S Hazelton Ln
- 2021 E Pegasus Dr
- 1947 E Orion St
- 6411 S River Dr Unit 6
- 1915 E Gemini Dr Unit 6
- 6320 S Shannon Dr Unit 9
- 6008 S Mcclintock Dr
- 6815 S Juniper St
- 2901 W Straford Dr
- 1960 E Krista Way
- 1861 E Sunburst Ln
- 1861 E Krista Way
- 2642 W Onza Ave
- 1701 E Julie Dr
- 1402 E Guadalupe Rd Unit 153
- 1402 E Guadalupe Rd Unit 149
- 7715 S Alder Dr
- 1936 E Redfield Rd
- 1944 E Redfield Rd
- 1937 E Redfield Rd
- 1943 E Redfield Rd Unit 2
- 1923 E Bendix Dr
- 1919 E Bendix Dr
- 1934 E Redfield Rd
- 1932 E Redfield Rd
- 1927 E Bendix Dr
- 1933 E Redfield Rd
- 1915 E Bendix Dr
- 1931 E Redfield Rd
- 1952 E Redfield Rd
- 1953 E Redfield Rd
- 1911 E Bendix Dr
- 1946 E Diamond Dr
- 1955 E Bendix Dr
- 1922 E Redfield Rd
- 1927 E Redfield Rd
- 6905 S Martin Ln
Your Personal Tour Guide
Ask me questions while you tour the home.