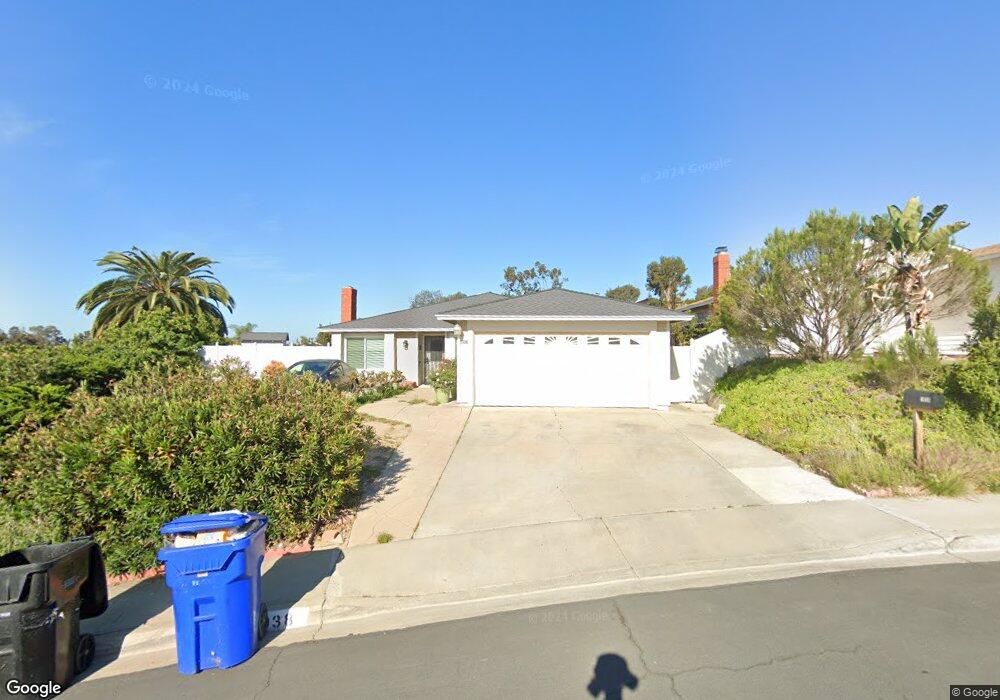
1938 Garden Park Ct San Diego, CA 92114
Bay Terraces NeighborhoodEstimated Value: $768,000 - $849,537
4
Beds
2
Baths
1,484
Sq Ft
$535/Sq Ft
Est. Value
About This Home
This home is located at 1938 Garden Park Ct, San Diego, CA 92114 and is currently estimated at $794,384, approximately $535 per square foot. 1938 Garden Park Ct is a home located in San Diego County with nearby schools including Bethune Middle School, Bell Middle School, and Morse High School.
Ownership History
Date
Name
Owned For
Owner Type
Purchase Details
Closed on
Jan 6, 2021
Sold by
Estrella Helena Mae Salamat
Bought by
Salamat Pedro Flores and Salamat Carmelita Santos
Current Estimated Value
Home Financials for this Owner
Home Financials are based on the most recent Mortgage that was taken out on this home.
Original Mortgage
$420,000
Outstanding Balance
$374,851
Interest Rate
2.71%
Mortgage Type
New Conventional
Estimated Equity
$419,533
Purchase Details
Closed on
May 23, 2016
Sold by
Lewis Michael and Lewis Riza Dela Fuente
Bought by
Salamat Pedro Flores and Salamat Carmelita Santos
Home Financials for this Owner
Home Financials are based on the most recent Mortgage that was taken out on this home.
Original Mortgage
$424,297
Interest Rate
3.66%
Mortgage Type
FHA
Purchase Details
Closed on
May 1, 1987
Bought by
Lewis Michael Riza D F
Purchase Details
Closed on
Nov 10, 1983
Create a Home Valuation Report for This Property
The Home Valuation Report is an in-depth analysis detailing your home's value as well as a comparison with similar homes in the area
Home Values in the Area
Average Home Value in this Area
Purchase History
| Date | Buyer | Sale Price | Title Company |
|---|---|---|---|
| Salamat Pedro Flores | -- | Fidelity National Title Co | |
| Salamat Pedro Flores | $435,000 | First American Title Company | |
| Lewis Michael Riza D F | $117,000 | -- | |
| -- | $92,200 | -- |
Source: Public Records
Mortgage History
| Date | Status | Borrower | Loan Amount |
|---|---|---|---|
| Open | Salamat Pedro Flores | $420,000 | |
| Closed | Salamat Pedro Flores | $424,297 |
Source: Public Records
Tax History Compared to Growth
Tax History
| Year | Tax Paid | Tax Assessment Tax Assessment Total Assessment is a certain percentage of the fair market value that is determined by local assessors to be the total taxable value of land and additions on the property. | Land | Improvement |
|---|---|---|---|---|
| 2025 | $6,558 | $541,738 | $252,186 | $289,552 |
| 2024 | $6,558 | $531,117 | $247,242 | $283,875 |
| 2023 | $6,413 | $520,704 | $242,395 | $278,309 |
| 2022 | $6,242 | $510,495 | $237,643 | $272,852 |
| 2021 | $5,895 | $475,731 | $124,479 | $351,252 |
| 2020 | $5,824 | $470,854 | $123,203 | $347,651 |
| 2019 | $5,720 | $461,623 | $120,788 | $340,835 |
| 2018 | $5,348 | $452,572 | $118,420 | $334,152 |
| 2017 | $5,221 | $443,699 | $116,099 | $327,600 |
| 2016 | $2,295 | $192,936 | $50,484 | $142,452 |
| 2015 | $2,262 | $190,039 | $49,726 | $140,313 |
| 2014 | $2,227 | $186,317 | $48,752 | $137,565 |
Source: Public Records
Map
Nearby Homes
- 763 Kingswood St
- 124 Palawan Way
- 240 Ledgewood Ln
- 7449 Bullock Dr
- 6872 Quebec Ct Unit 5
- 7281 Danawoods Ct
- 7549 Goode St
- 7040 Tenbury Ct
- 7263 Aquamarine Rd
- 177 Coralwood Dr
- 849 Plaza Cuernavaca Way
- 2620 Pennington Ln
- 111 69th St
- 2216 Calle Chanate
- 7089 Wattle Dr
- 6365 Calle Pavana
- 7358 Gribble St
- 1153 Manzana Way
- 6968 Appian Dr
- 2876 Casey St Unit B
- 1932 Garden Park Ct
- 1929 Mesa Park Ln
- 1935 Mesa Park Ln
- 1925 Mesa Park Ln
- 1928 Garden Park Ct
- 594 Kingswood St
- 609 Kingswood St
- 619 Kingswood St
- 1919 Mesa Park Ln
- 601 Kingswood St
- 627 Kingswood St
- 593 Kingswood St
- 584 Kingswood St
- 637 Kingswood St
- 1924 Garden Park Ct
- 1915 Mesa Park Ln
- 585 Kingswood St
- 645 Kingswood St
- 1938 Mesa Park Ln
- 1920 Garden Park Ct