1938 K St Sparks, NV 89431
Downtown Sparks NeighborhoodEstimated Value: $301,000 - $370,381
3
Beds
1
Bath
1,036
Sq Ft
$332/Sq Ft
Est. Value
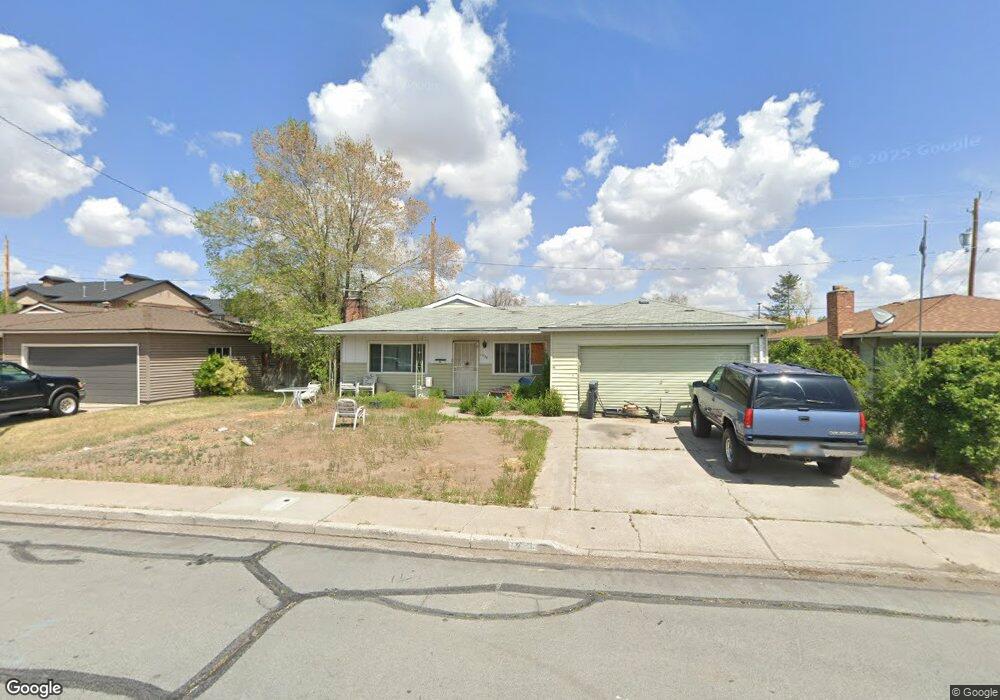
About This Home
This home is located at 1938 K St, Sparks, NV 89431 and is currently estimated at $344,460, approximately $332 per square foot. 1938 K St is a home located in Washoe County with nearby schools including Kate M Smith Elementary School, Sparks Middle School, and Sparks High School.
Ownership History
Date
Name
Owned For
Owner Type
Purchase Details
Closed on
Jan 27, 2016
Sold by
Entrust Group Inc
Bought by
Preferred Trust Company Llc
Current Estimated Value
Purchase Details
Closed on
Mar 21, 2011
Sold by
1938 K Street Llc
Bought by
01 The Entrust Group Inc and Stanley L Benson Ira #36-10542
Purchase Details
Closed on
Mar 4, 2011
Sold by
Deboer Susan and Wachtler Ronald D
Bought by
1938 K Street Llc
Create a Home Valuation Report for This Property
The Home Valuation Report is an in-depth analysis detailing your home's value as well as a comparison with similar homes in the area
Home Values in the Area
Average Home Value in this Area
Purchase History
| Date | Buyer | Sale Price | Title Company |
|---|---|---|---|
| Preferred Trust Company Llc | $85,000 | None Available | |
| 01 The Entrust Group Inc | $60,000 | Western Title Company | |
| 1938 K Street Llc | $60,000 | Western Title Company |
Source: Public Records
Tax History Compared to Growth
Tax History
| Year | Tax Paid | Tax Assessment Tax Assessment Total Assessment is a certain percentage of the fair market value that is determined by local assessors to be the total taxable value of land and additions on the property. | Land | Improvement |
|---|---|---|---|---|
| 2025 | $1,177 | $51,964 | $36,085 | $15,879 |
| 2024 | $1,177 | $49,522 | $33,880 | $15,642 |
| 2023 | $712 | $45,808 | $31,325 | $14,483 |
| 2022 | $692 | $39,374 | $27,580 | $11,794 |
| 2021 | $642 | $29,372 | $17,885 | $11,487 |
| 2020 | $603 | $28,700 | $17,430 | $11,270 |
| 2019 | $575 | $26,532 | $15,855 | $10,677 |
| 2018 | $546 | $21,294 | $11,060 | $10,234 |
| 2017 | $527 | $19,395 | $9,345 | $10,050 |
| 2016 | $514 | $18,423 | $8,365 | $10,058 |
| 2015 | $513 | $17,941 | $7,945 | $9,996 |
| 2014 | $499 | $15,688 | $6,230 | $9,458 |
| 2013 | -- | $13,167 | $3,955 | $9,212 |
Source: Public Records
Map
Nearby Homes