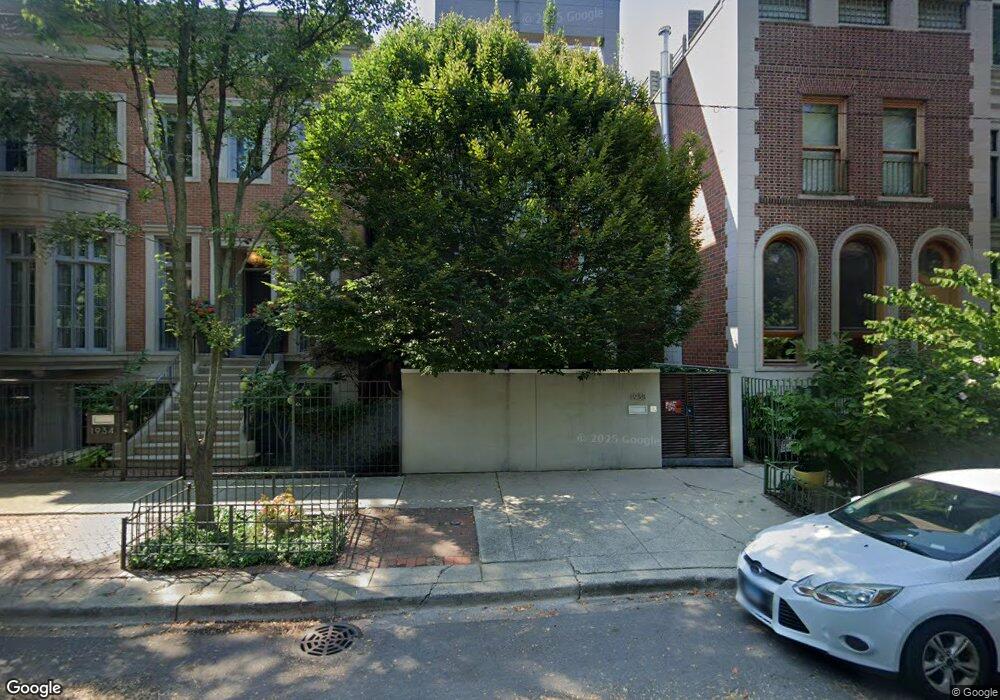
1938 N Howe St Unit PD Chicago, IL 60614
Old Town NeighborhoodEstimated Value: $2,339,000 - $4,111,000
4
Beds
4
Baths
3,625
Sq Ft
$823/Sq Ft
Est. Value
About This Home
This home is located at 1938 N Howe St Unit PD, Chicago, IL 60614 and is currently estimated at $2,982,882, approximately $822 per square foot. 1938 N Howe St Unit PD is a home located in Cook County with nearby schools including Abraham Lincoln Elementary School, Lincoln Park High School, and St. James Lutheran School.
Ownership History
Date
Name
Owned For
Owner Type
Purchase Details
Closed on
May 16, 2022
Sold by
Goparaju Madhav Srinivas and Goparaju Jaskirat
Bought by
Madhav Goparaju And Jaskirat Sandhu Living Tr and Goparaju
Current Estimated Value
Purchase Details
Closed on
Nov 2, 2006
Sold by
Fukunaga Yuji M
Bought by
Goparaju Madhav
Home Financials for this Owner
Home Financials are based on the most recent Mortgage that was taken out on this home.
Original Mortgage
$352,100
Interest Rate
6.75%
Mortgage Type
Unknown
Purchase Details
Closed on
Jul 7, 2003
Sold by
Filipiak Curtis and Filipiak Shannon
Bought by
Goparaju Madhav
Home Financials for this Owner
Home Financials are based on the most recent Mortgage that was taken out on this home.
Original Mortgage
$418,035
Interest Rate
5.35%
Mortgage Type
Unknown
Purchase Details
Closed on
Apr 26, 2003
Sold by
Wall Dix Margaret
Bought by
Margaret Wall Dix 2003 Trust
Purchase Details
Closed on
Aug 26, 1997
Sold by
Broderick Matthew and Broderick Cathy Elaine
Bought by
Filipiak Curtis and Pauley Shannon A
Home Financials for this Owner
Home Financials are based on the most recent Mortgage that was taken out on this home.
Original Mortgage
$232,800
Interest Rate
7.37%
Purchase Details
Closed on
Feb 24, 1997
Sold by
Broderick Matthew J
Bought by
Broderick Matthew J and Broderick Cathy Elaine
Home Financials for this Owner
Home Financials are based on the most recent Mortgage that was taken out on this home.
Original Mortgage
$162,500
Interest Rate
7.93%
Purchase Details
Closed on
Mar 28, 1995
Sold by
Henley Clay B and Henley Cheryl P
Bought by
Fukumaga Yuji M
Home Financials for this Owner
Home Financials are based on the most recent Mortgage that was taken out on this home.
Original Mortgage
$169,600
Interest Rate
8.5%
Create a Home Valuation Report for This Property
The Home Valuation Report is an in-depth analysis detailing your home's value as well as a comparison with similar homes in the area
Home Values in the Area
Average Home Value in this Area
Purchase History
| Date | Buyer | Sale Price | Title Company |
|---|---|---|---|
| Madhav Goparaju And Jaskirat Sandhu Living Tr | -- | Robins Michael J | |
| Goparaju Madhav | $469,500 | Multiple | |
| Goparaju Madhav | $465,000 | -- | |
| Margaret Wall Dix 2003 Trust | -- | -- | |
| Filipiak Curtis | $194,000 | 1St American Title | |
| Broderick Matthew J | -- | -- | |
| Fukumaga Yuji M | $212,000 | Attorneys Title Guaranty Fun |
Source: Public Records
Mortgage History
| Date | Status | Borrower | Loan Amount |
|---|---|---|---|
| Previous Owner | Goparaju Madhav | $352,100 | |
| Previous Owner | Goparaju Madhav | $418,035 | |
| Previous Owner | Filipiak Curtis | $232,800 | |
| Previous Owner | Broderick Matthew J | $162,500 | |
| Previous Owner | Fukumaga Yuji M | $169,600 | |
| Closed | Filipiak Curtis | $29,100 |
Source: Public Records
Tax History Compared to Growth
Tax History
| Year | Tax Paid | Tax Assessment Tax Assessment Total Assessment is a certain percentage of the fair market value that is determined by local assessors to be the total taxable value of land and additions on the property. | Land | Improvement |
|---|---|---|---|---|
| 2024 | $46,647 | $217,000 | $42,579 | $174,421 |
| 2023 | $45,451 | $224,401 | $34,338 | $190,063 |
| 2022 | $45,451 | $224,401 | $34,338 | $190,063 |
| 2021 | $44,455 | $224,399 | $34,337 | $190,062 |
| 2020 | $38,842 | $177,461 | $30,217 | $147,244 |
| 2019 | $38,066 | $192,893 | $30,217 | $162,676 |
| 2018 | $37,424 | $192,893 | $30,217 | $162,676 |
| 2017 | $37,316 | $176,720 | $24,723 | $151,997 |
| 2016 | $34,895 | $176,720 | $24,723 | $151,997 |
| 2015 | $31,903 | $176,720 | $24,723 | $151,997 |
| 2014 | $27,966 | $153,297 | $19,229 | $134,068 |
| 2013 | $27,403 | $153,297 | $19,229 | $134,068 |
Source: Public Records
Map
Nearby Homes
- 1878 N Orchard St
- 1865 N Burling St
- 1964 N Burling St
- 1853 N Burling St
- 1913 N Halsted St Unit 1
- 1849 N Mohawk St Unit 2
- 1926 N Halsted St
- 2054 N Mohawk St
- 1851 N Halsted St Unit 2
- 1862 N Halsted St Unit 3N
- 1921 N Dayton St
- 515 W Dickens Ave
- 505 W Menomonee St
- 1848 N Dayton St
- 1724 N Mohawk St Unit 2
- 1733 N Mohawk St Unit 3N
- 1836 N Dayton St Unit 1836
- 1720 N Mohawk St
- 1812 N Dayton St Unit 1812
- 1837 N Fremont St
- 1938 N Howe St Unit 2
- 1938 N Howe St Unit E
- 1940 N Howe St
- 1934 N Howe St
- 1944 N Howe St Unit C
- 1944 N Howe St Unit D
- 1944 N Howe St Unit A
- 1944 N Howe St Unit B
- 1944 N Howe St
- 1932 N Howe St
- 1930 N Howe St
- 1946 N Howe St
- 1950 N Howe St Unit C
- 1950 N Howe St Unit A
- 1950 N Howe St Unit B
- 1950 N Howe St
- 1924 N Howe St
- 1922 N Howe St
- 1922 N Howe St
- 1939 N Orchard St