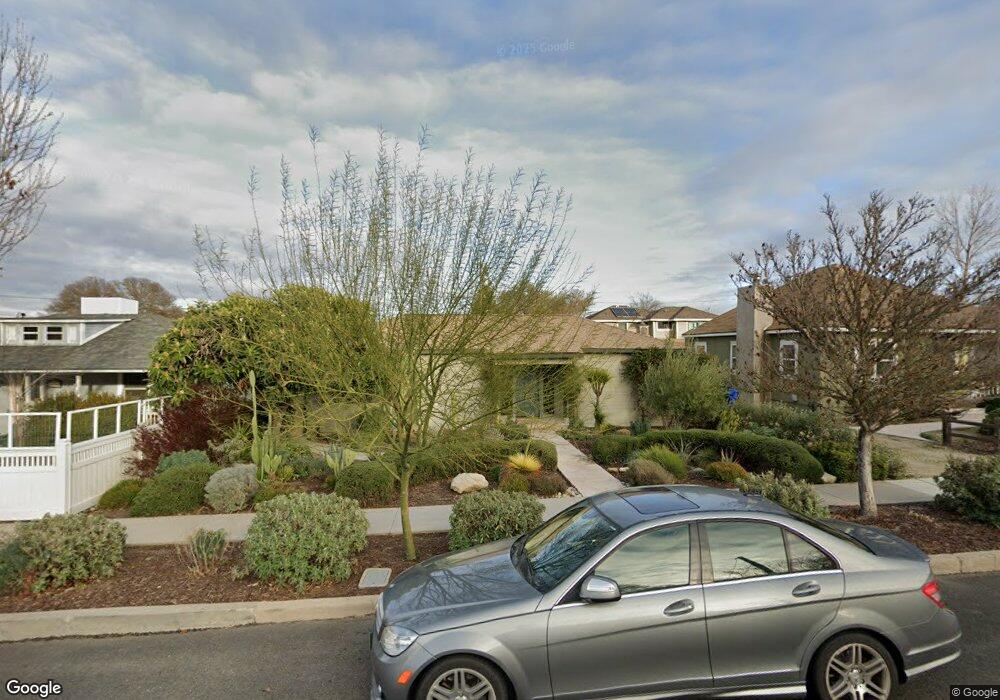
1938 Olive St Paso Robles, CA 93446
Estimated Value: $732,000 - $842,000
3
Beds
2
Baths
1,614
Sq Ft
$483/Sq Ft
Est. Value
About This Home
This home is located at 1938 Olive St, Paso Robles, CA 93446 and is currently estimated at $778,910, approximately $482 per square foot. 1938 Olive St is a home located in San Luis Obispo County with nearby schools including Glen Speck Elementary School, George H. Flamson Middle School, and Paso Robles High School.
Ownership History
Date
Name
Owned For
Owner Type
Purchase Details
Closed on
Aug 13, 2018
Sold by
Marks Roderick Brian and The Donald M Marks And Marj
Bought by
Carroll Bryan and Stephens Sophia
Current Estimated Value
Home Financials for this Owner
Home Financials are based on the most recent Mortgage that was taken out on this home.
Original Mortgage
$419,550
Outstanding Balance
$364,362
Interest Rate
4.5%
Mortgage Type
New Conventional
Estimated Equity
$414,548
Purchase Details
Closed on
Mar 3, 2015
Sold by
Marks Donald M
Bought by
Marks Donald M
Purchase Details
Closed on
Feb 10, 1999
Sold by
Marks Donald M and Marks Marjory B
Bought by
Marks Donald M and Marks Marjory B
Purchase Details
Closed on
Sep 27, 1994
Sold by
Patterson George R and Patterson Sharon K
Bought by
Patterson Mark R and Patterson Peggy S
Home Financials for this Owner
Home Financials are based on the most recent Mortgage that was taken out on this home.
Original Mortgage
$100,000
Interest Rate
4.5%
Purchase Details
Closed on
Sep 20, 1994
Sold by
Patterson Mark R and Patterson Peggy S
Bought by
Marks Donald M and Marks Marjory B
Home Financials for this Owner
Home Financials are based on the most recent Mortgage that was taken out on this home.
Original Mortgage
$100,000
Interest Rate
4.5%
Create a Home Valuation Report for This Property
The Home Valuation Report is an in-depth analysis detailing your home's value as well as a comparison with similar homes in the area
Purchase History
| Date | Buyer | Sale Price | Title Company |
|---|---|---|---|
| Carroll Bryan | $525,000 | Placer Title Co | |
| Marks Donald M | -- | Public | |
| Marks Donald M | -- | -- | |
| Patterson Mark R | $40,000 | Chicago Title Company | |
| Marks Donald M | $125,000 | Chicago Title Company |
Source: Public Records
Mortgage History
| Date | Status | Borrower | Loan Amount |
|---|---|---|---|
| Open | Carroll Bryan | $419,550 | |
| Previous Owner | Marks Donald M | $100,000 |
Source: Public Records
Tax History
| Year | Tax Paid | Tax Assessment Tax Assessment Total Assessment is a certain percentage of the fair market value that is determined by local assessors to be the total taxable value of land and additions on the property. | Land | Improvement |
|---|---|---|---|---|
| 2025 | $6,300 | $585,139 | $267,722 | $317,417 |
| 2024 | $6,211 | $573,667 | $262,473 | $311,194 |
| 2023 | $6,211 | $562,420 | $257,327 | $305,093 |
| 2022 | $6,180 | $551,393 | $252,282 | $299,111 |
| 2021 | $6,075 | $540,583 | $247,336 | $293,247 |
| 2020 | $5,992 | $535,041 | $244,800 | $290,241 |
| 2019 | $5,907 | $524,550 | $240,000 | $284,550 |
| 2018 | $2,091 | $184,500 | $73,798 | $110,702 |
| 2017 | $1,890 | $180,883 | $72,351 | $108,532 |
| 2016 | $1,851 | $177,337 | $70,933 | $106,404 |
| 2015 | $1,843 | $174,674 | $69,868 | $104,806 |
| 2014 | $1,778 | $171,253 | $68,500 | $102,753 |
Source: Public Records
Map
Nearby Homes
Your Personal Tour Guide
Ask me questions while you tour the home.