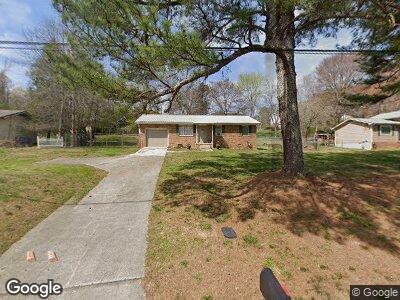
1938 Peavine Rd Rock Spring, GA 30739
Rock Spring NeighborhoodEstimated Value: $150,855 - $206,000
--
Bed
2
Baths
1,008
Sq Ft
$186/Sq Ft
Est. Value
About This Home
This home is located at 1938 Peavine Rd, Rock Spring, GA 30739 and is currently estimated at $187,214, approximately $185 per square foot. 1938 Peavine Rd is a home located in Walker County with nearby schools including Rock Spring Elementary School, Lafayette High School, and Alice M Daley Adventist School.
Ownership History
Date
Name
Owned For
Owner Type
Purchase Details
Closed on
Aug 30, 2006
Sold by
Bill Otting Inc
Bought by
Caldwell J Thomas
Current Estimated Value
Purchase Details
Closed on
Aug 29, 2006
Sold by
Bill Otting Inc
Bought by
Caldwell J Thomas
Purchase Details
Closed on
Dec 30, 2005
Sold by
Not Provided
Bought by
Zornes M Elizabeth
Purchase Details
Closed on
Oct 26, 2000
Sold by
Jones Jimmy L and Jones Robin R
Bought by
Mcdaniel James E
Purchase Details
Closed on
Apr 6, 1991
Sold by
Tucker William L and Tucker Kandace
Bought by
Jones Jimmy L and Jones Robin R
Purchase Details
Closed on
Oct 10, 1979
Sold by
Lowes William D and Lowes Louwana
Bought by
Tucker William L and Tucker Kandace
Purchase Details
Closed on
Apr 9, 1976
Sold by
Craig Buford L General Contra
Bought by
Lowes William D and Lowes Louwana
Purchase Details
Closed on
Aug 26, 1975
Bought by
Craig Buford L General Contra
Create a Home Valuation Report for This Property
The Home Valuation Report is an in-depth analysis detailing your home's value as well as a comparison with similar homes in the area
Home Values in the Area
Average Home Value in this Area
Purchase History
| Date | Buyer | Sale Price | Title Company |
|---|---|---|---|
| Caldwell J Thomas | $35,000 | -- | |
| Caldwell J Thomas | $35,000 | -- | |
| Zornes M Elizabeth | $65,000 | -- | |
| Mcdaniel James E | -- | -- | |
| Jones Jimmy L | $35,000 | -- | |
| Tucker William L | -- | -- | |
| Lowes William D | -- | -- | |
| Craig Buford L General Contra | -- | -- |
Source: Public Records
Mortgage History
| Date | Status | Borrower | Loan Amount |
|---|---|---|---|
| Open | Zornes Elizabeth | $46,162 |
Source: Public Records
Tax History Compared to Growth
Tax History
| Year | Tax Paid | Tax Assessment Tax Assessment Total Assessment is a certain percentage of the fair market value that is determined by local assessors to be the total taxable value of land and additions on the property. | Land | Improvement |
|---|---|---|---|---|
| 2024 | $529 | $57,978 | $5,068 | $52,910 |
| 2023 | $497 | $55,350 | $5,068 | $50,282 |
| 2022 | $417 | $48,313 | $5,068 | $43,245 |
| 2021 | $359 | $33,071 | $5,068 | $28,003 |
| 2020 | $338 | $27,536 | $5,068 | $22,468 |
| 2019 | $351 | $27,536 | $5,068 | $22,468 |
| 2018 | $729 | $27,536 | $5,068 | $22,468 |
| 2017 | $880 | $27,826 | $5,358 | $22,468 |
| 2016 | $762 | $27,826 | $5,358 | $22,468 |
| 2015 | $740 | $25,436 | $5,068 | $20,368 |
| 2014 | $656 | $25,436 | $5,068 | $20,368 |
| 2013 | -- | $25,436 | $5,068 | $20,368 |
Source: Public Records
Map
Nearby Homes
- 15 W Acorn Dr
- 50 Windy Oak Dr
- 34 E Acorn Dr
- 344 Twelve Oaks Dr
- 55 E Acorn Dr
- 1590 Peavine Rd
- 642 E Long Hollow Rd
- 420 Long Hollow Rd
- 1121 Arnold Rd
- 0 N Highway 27
- 183 Long Hollow Rd
- 1476 Arnold Rd
- 183 Long Hollow Rd
- 139 Old Highway 27
- 72 Crest Dr
- 81 Arnold Rd
- 186 Henry Dr
- 56 Deer Ridge Ln
- 200 Hunting Ridge Cir
- 494 Goodson Cir
- 1938 Peavine Rd
- 1916 Peavine Rd
- 1921 Peavine Rd
- 1956 Peavine Rd
- 1908 Peavine Rd
- 171 Dogwood Cir
- 177 Dogwood Cir
- 1976 Peavine Rd
- 145 Dogwood Cir
- Lot 4 Peavine Rd
- 0 Peavine Rd Unit 1288059
- 0 Peavine Rd Unit RTC2723918
- 85 Peavine Rd
- 0 Peavine Rd Unit 1074879
- 0 Peavine Rd Unit 1315862
- 0 Peavine Rd Unit 12 1288059
- 0 Peavine Rd
- 1985 Peavine Rd
- 1884 Peavine Rd
- 125 Dogwood Cir