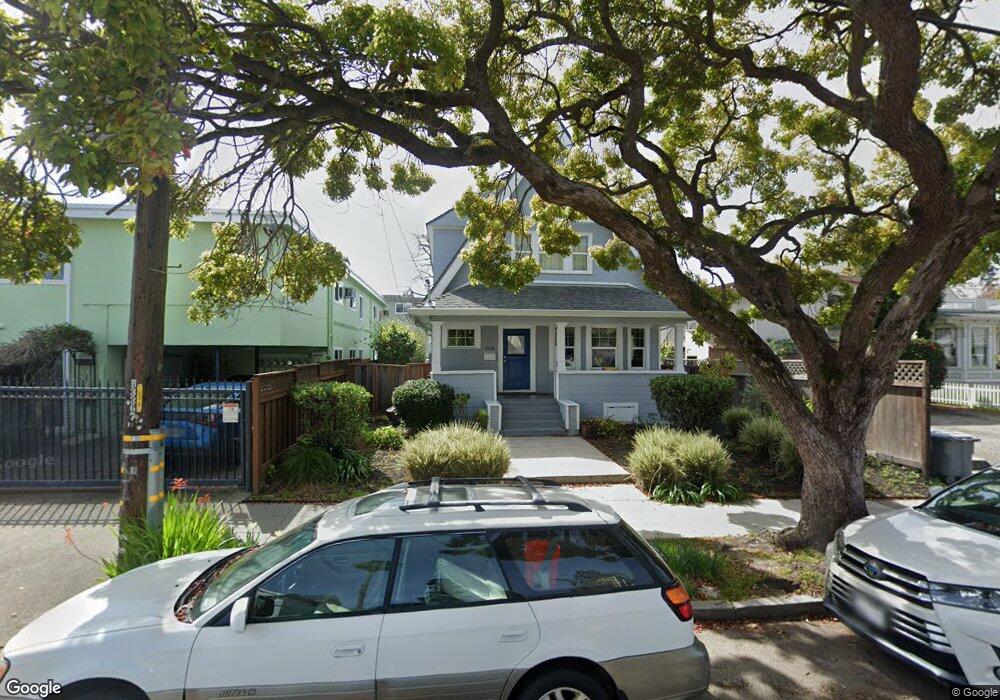
1938 Stuart St Berkeley, CA 94703
South Berkeley NeighborhoodEstimated Value: $1,432,000 - $1,779,032
4
Beds
3
Baths
2,043
Sq Ft
$781/Sq Ft
Est. Value
About This Home
This home is located at 1938 Stuart St, Berkeley, CA 94703 and is currently estimated at $1,595,508, approximately $780 per square foot. 1938 Stuart St is a home located in Alameda County with nearby schools including Malcolm X Elementary School, Emerson Elementary School, and John Muir Elementary School.
Ownership History
Date
Name
Owned For
Owner Type
Purchase Details
Closed on
Apr 5, 2019
Sold by
Joseph Robbie and Presley Andrew
Bought by
Joseph Presley Family Living Trust
Current Estimated Value
Purchase Details
Closed on
Dec 3, 2018
Sold by
Troubadours Enterprises Inc
Bought by
Joseph Robbie and Presley Andrew
Home Financials for this Owner
Home Financials are based on the most recent Mortgage that was taken out on this home.
Original Mortgage
$1,084,000
Outstanding Balance
$955,027
Interest Rate
4.8%
Mortgage Type
New Conventional
Estimated Equity
$640,481
Purchase Details
Closed on
Nov 22, 2017
Sold by
Horton Neil F and Estate Of Gertrude Diaz Elizon
Bought by
Troubadours Enterprises Inc
Home Financials for this Owner
Home Financials are based on the most recent Mortgage that was taken out on this home.
Original Mortgage
$660,000
Interest Rate
3.94%
Mortgage Type
Commercial
Create a Home Valuation Report for This Property
The Home Valuation Report is an in-depth analysis detailing your home's value as well as a comparison with similar homes in the area
Home Values in the Area
Average Home Value in this Area
Purchase History
| Date | Buyer | Sale Price | Title Company |
|---|---|---|---|
| Joseph Presley Family Living Trust | -- | None Available | |
| Joseph Robbie | $1,355,000 | Chicago Title Company | |
| Troubadours Enterprises Inc | $825,000 | First American Title Company |
Source: Public Records
Mortgage History
| Date | Status | Borrower | Loan Amount |
|---|---|---|---|
| Open | Joseph Robbie | $1,084,000 | |
| Previous Owner | Troubadours Enterprises Inc | $660,000 |
Source: Public Records
Tax History
| Year | Tax Paid | Tax Assessment Tax Assessment Total Assessment is a certain percentage of the fair market value that is determined by local assessors to be the total taxable value of land and additions on the property. | Land | Improvement |
|---|---|---|---|---|
| 2025 | $21,483 | $1,504,502 | $613,525 | $897,977 |
| 2024 | $21,483 | $1,474,868 | $601,496 | $880,372 |
| 2023 | $21,000 | $1,452,816 | $589,704 | $863,112 |
| 2022 | $20,615 | $1,417,334 | $578,143 | $846,191 |
| 2021 | $20,698 | $1,389,408 | $566,808 | $829,600 |
| 2020 | $19,752 | $1,382,100 | $561,000 | $821,100 |
| 2019 | $19,171 | $1,355,000 | $550,000 | $805,000 |
| 2018 | $12,749 | $825,000 | $500,000 | $325,000 |
| 2017 | $2,868 | $38,025 | $23,449 | $14,576 |
| 2016 | $2,650 | $37,280 | $22,989 | $14,291 |
| 2015 | $2,587 | $36,720 | $22,644 | $14,076 |
| 2014 | $2,462 | $36,000 | $22,200 | $13,800 |
Source: Public Records
Map
Nearby Homes
- 2701 Grant St
- 1901 Parker St Unit 3
- 2727 McGee Ave
- 2018 Blake St
- 2057 Emerson St
- 2926 Ellis St
- 2110 Ashby Ave
- 2923 Wheeler St
- 1612 Carleton St
- 1646 Ashby Ave
- 1612 Parker St
- 2124 Prince St
- 1530 Stuart St
- 2243 Ashby Ave
- 1645 Dwight Way
- 1535 Julia St
- 2319 Ward St
- 3046 Deakin St
- 1515 Derby St
- 6555 Shattuck Ave
- 1936 Stuart St Unit 6
- 1936 Stuart St
- 1934 Stuart St Unit Upper
- 1934 Stuart St
- 1932 Stuart St
- 1941 Oregon St
- 1939 Oregon St
- 1937 Oregon St
- 1930 Stuart St Unit Lower
- 1930 Stuart St Unit Upper
- 1930 Stuart St
- 1933 Oregon St
- 1928 Stuart St
- 1939 Stuart St Unit 3
- 1939 Stuart St
- 1935 Stuart St
- 1927 Oregon St
- 2041 Oregon St
- 1933 Stuart St
- 1933 Stuart St Unit A
Your Personal Tour Guide
Ask me questions while you tour the home.