Estimated Value: $234,460 - $275,000
4
Beds
1
Bath
2,004
Sq Ft
$123/Sq Ft
Est. Value
About This Home
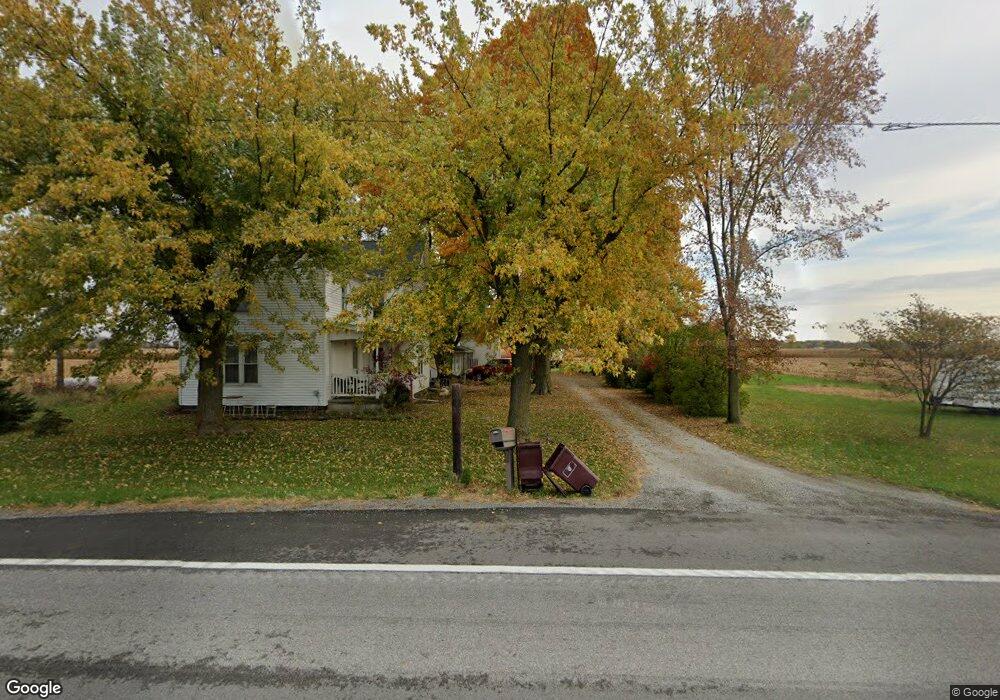
This home is located at 19382 Saint Johns Rd, Lima, OH 45806 and is currently estimated at $247,365, approximately $123 per square foot. 19382 Saint Johns Rd is a home located in Auglaize County with nearby schools including Cridersville Elementary School, Wapakoneta High School, and Wapakoneta Middle School.
Ownership History
Date
Name
Owned For
Owner Type
Purchase Details
Closed on
Jun 14, 2019
Sold by
Bungard Harry W and Bungard Teresa C
Bought by
Hengstler Holden S
Current Estimated Value
Home Financials for this Owner
Home Financials are based on the most recent Mortgage that was taken out on this home.
Original Mortgage
$141,988
Outstanding Balance
$124,061
Interest Rate
4.1%
Mortgage Type
VA
Estimated Equity
$123,304
Purchase Details
Closed on
Oct 29, 2004
Sold by
Weston Lisa M
Bought by
Bungard Harry W
Purchase Details
Closed on
Mar 29, 2002
Sold by
Weston Lisa M
Bought by
Weston Lisa M
Purchase Details
Closed on
Oct 10, 2000
Sold by
Lowry John W
Bought by
Weston Lisa M
Purchase Details
Closed on
Mar 1, 2000
Sold by
Sass Doris
Bought by
Lowry John W
Create a Home Valuation Report for This Property
The Home Valuation Report is an in-depth analysis detailing your home's value as well as a comparison with similar homes in the area
Purchase History
| Date | Buyer | Sale Price | Title Company |
|---|---|---|---|
| Hengstler Holden S | $139,000 | None Available | |
| Bungard Harry W | $101,500 | -- | |
| Weston Lisa M | -- | -- | |
| Weston Lisa M | $93,700 | -- | |
| Lowry John W | $105,000 | -- |
Source: Public Records
Mortgage History
| Date | Status | Borrower | Loan Amount |
|---|---|---|---|
| Open | Hengstler Holden S | $141,988 |
Source: Public Records
Tax History
| Year | Tax Paid | Tax Assessment Tax Assessment Total Assessment is a certain percentage of the fair market value that is determined by local assessors to be the total taxable value of land and additions on the property. | Land | Improvement |
|---|---|---|---|---|
| 2025 | $2,296 | $45,250 | $6,730 | $38,520 |
| 2024 | $2,296 | $45,250 | $6,730 | $38,520 |
| 2023 | $1,559 | $45,250 | $6,730 | $38,520 |
| 2022 | $1,576 | $41,680 | $5,610 | $36,070 |
| 2021 | $1,556 | $41,680 | $5,610 | $36,070 |
| 2020 | $789 | $41,675 | $5,607 | $36,068 |
| 2019 | $1,016 | $34,805 | $4,673 | $30,132 |
| 2018 | $974 | $34,805 | $4,673 | $30,132 |
| 2017 | $967 | $34,805 | $4,673 | $30,132 |
| 2016 | $948 | $34,514 | $4,449 | $30,065 |
| 2015 | $947 | $34,514 | $4,449 | $30,065 |
| 2014 | $956 | $34,514 | $4,449 | $30,065 |
| 2013 | $983 | $34,514 | $4,449 | $30,065 |
Source: Public Records
Map
Nearby Homes
- 17946 National Rd
- 20228 Fairmount Rd
- 0 Ohio 67
- 37 N Main St
- 138 Main St
- 17 E Walnut St
- 32 Kyle Dr
- St Johns Rd
- 212 S Oak St
- 106 S Oak St
- 20630 State Route 67
- 210 E High St
- 18609 County Road 25a
- 310 W Main St
- 3828 Saint Johns Rd
- 1200 E Breese Rd
- 703 Greenbriar St
- 2035 Maplewood Ln
- 2677 Summer Rambo Ct
- 2638 Summer Rambo Ct
- 19382 St Route
- 19475 Saint Johns Rd
- 19475 State Route 65
- 19033 River Rd
- 19475 State Route
- 19603 Ohio 65
- 19063 Saint Johns Rd
- 18983 Saint Johns Rd
- 18983 State Route 65
- 18983 State Route 65
- 65 St Rt65
- 18892 Buckland Holden Rd
- 18760 Sellers Rd
- 18954 State Route 65
- 19368 River Rd
- 18753 Sellers Rd
- 18645 Buckland Holden Rd
- 18668 Sellers Rd
- 19947 Saint Johns Rd
- 19947 State Route 65