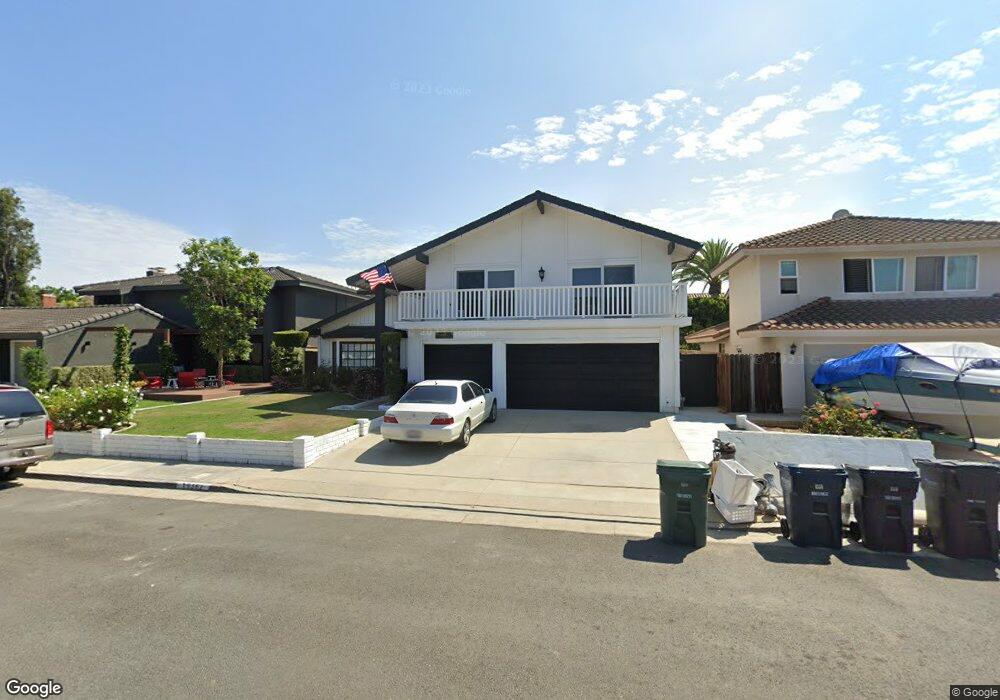
19382 Shady Harbor Cir Huntington Beach, CA 92648
Seacliff NeighborhoodEstimated Value: $1,987,865 - $2,652,000
4
Beds
3
Baths
2,612
Sq Ft
$908/Sq Ft
Est. Value
About This Home
This home is located at 19382 Shady Harbor Cir, Huntington Beach, CA 92648 and is currently estimated at $2,371,466, approximately $907 per square foot. 19382 Shady Harbor Cir is a home located in Orange County with nearby schools including Huntington Seacliff Elementary, Ethel Dwyer Middle, and Huntington Beach High School.
Ownership History
Date
Name
Owned For
Owner Type
Purchase Details
Closed on
Sep 17, 2014
Sold by
Gibson Maria K
Bought by
Gibson Jeffrey M
Current Estimated Value
Purchase Details
Closed on
Jul 9, 2014
Sold by
Andrews Kelli Michele
Bought by
Gibson Jeffrey M
Home Financials for this Owner
Home Financials are based on the most recent Mortgage that was taken out on this home.
Original Mortgage
$650,000
Interest Rate
4%
Mortgage Type
Adjustable Rate Mortgage/ARM
Purchase Details
Closed on
Aug 31, 2011
Sold by
Gibson Joann M
Bought by
Gibson Joann M
Home Financials for this Owner
Home Financials are based on the most recent Mortgage that was taken out on this home.
Original Mortgage
$140,000
Interest Rate
4.46%
Mortgage Type
New Conventional
Purchase Details
Closed on
Aug 30, 2011
Sold by
Gibson Joann M
Bought by
Gibson Joann M and Jo Ann Gibson Revocable Living Trust
Home Financials for this Owner
Home Financials are based on the most recent Mortgage that was taken out on this home.
Original Mortgage
$140,000
Interest Rate
4.46%
Mortgage Type
New Conventional
Purchase Details
Closed on
Jun 27, 2001
Sold by
Gibson Jo Ann M
Bought by
Gibson Jo Ann M and The Jo Ann M Gibson Revocable Living Tr
Create a Home Valuation Report for This Property
The Home Valuation Report is an in-depth analysis detailing your home's value as well as a comparison with similar homes in the area
Home Values in the Area
Average Home Value in this Area
Purchase History
| Date | Buyer | Sale Price | Title Company |
|---|---|---|---|
| Gibson Jeffrey M | -- | First American Title Company | |
| Gibson Jeffrey M | -- | First American Title Company | |
| Gibson Joann M | -- | First American Title Ofs | |
| Gibson Joann M | -- | Accommodation | |
| Gibson Jo Ann M | -- | -- |
Source: Public Records
Mortgage History
| Date | Status | Borrower | Loan Amount |
|---|---|---|---|
| Previous Owner | Gibson Jeffrey M | $650,000 | |
| Previous Owner | Gibson Joann M | $140,000 |
Source: Public Records
Tax History Compared to Growth
Tax History
| Year | Tax Paid | Tax Assessment Tax Assessment Total Assessment is a certain percentage of the fair market value that is determined by local assessors to be the total taxable value of land and additions on the property. | Land | Improvement |
|---|---|---|---|---|
| 2025 | $2,298 | $176,379 | $47,012 | $129,367 |
| 2024 | $2,298 | $172,921 | $46,090 | $126,831 |
| 2023 | $2,244 | $169,531 | $45,186 | $124,345 |
| 2022 | $1,789 | $130,031 | $44,300 | $85,731 |
| 2021 | $1,757 | $127,482 | $43,432 | $84,050 |
| 2020 | $8,913 | $126,175 | $42,986 | $83,189 |
| 2019 | $8,896 | $123,701 | $42,143 | $81,558 |
| 2018 | $8,772 | $112,396 | $41,317 | $71,079 |
| 2017 | $1,582 | $110,193 | $40,507 | $69,686 |
| 2016 | $1,521 | $108,033 | $39,713 | $68,320 |
| 2015 | $1,505 | $106,411 | $39,117 | $67,294 |
| 2014 | $1,397 | $104,327 | $38,351 | $65,976 |
Source: Public Records
Map
Nearby Homes
- 19321 Manor Point Cir
- 6781 Lawn Haven Dr
- 19532 Summer Breeze Ln
- 19702 Quiet Bay Ln
- 19741 Quiet Bay Ln
- 6632 Cedarwood Dr
- 19748 Shorecliff Ln
- 6662 Brentwood Dr
- 19731 Estate Cir
- 6403 Royal Grove Dr
- 18976 Rockinghorse Ln
- 19115 Callaway Cir
- 7262 Yellowtail Dr
- 6776 Findley Cir
- 19662 Stern Ln
- 19109 Azul Ln
- 19811 Deep Harbor Dr
- 7351 Coho Dr Unit 207
- 620 22nd St
- 7412 Seabluff Dr Unit 108
- 19362 Shady Harbor Cir
- 19392 Shady Harbor Cir
- 19371 Surfdale Ln
- 19381 Surfdale Ln
- 19352 Shady Harbor Cir
- 6871 Evening Hill Dr
- 19351 Surfdale Ln
- 6851 Evening Hill Dr
- 6881 Evening Hill Dr
- 19391 Shady Harbor Cir
- 19381 Shady Harbor Cir
- 19341 Surfdale Ln
- 19342 Shady Harbor Cir
- 19351 Shady Harbor Cir
- 6891 Evening Hill Dr
- 19401 Shady Harbor Cir
- 19341 Shady Harbor Cir
- 19331 Surfdale Ln
- 6781 Evening Hill Dr
- 19382 Surfdale Ln